Posts tagged andrew nelson
The Difference Between Speculating and Planning
 

A week ago, I came across a chart that does a nice job representing the call volume we have been experiencing at Human Investing in 2020. While the amount of calls we receive does not equal the amount of times people search for CNBC, the two data points are certainly correlated.

google-searches-stocks-cnbc-hartford.jpg

The image is titled, “When Markets Fall, We Search”, and ultimately shows that individuals have been more likely to seek out CNBC (market related news) any time the market has fallen over the last 15 years.

I’d argue that you could replace ‘search’ with ‘speculate’ and both the phrase and the chart would remain true, “when markets fall, we speculate”. Given the state of current affairs and the upcoming presidential election, individuals are worrying about their retirement accounts. A growing number of conversations our team has with individuals inside of retirement plans sound something like this:

Caller: “I’m fearful of (X) candidate winning the election because I’m affiliated with (Y) political party (both sides are saying this). Additionally, there is uncertainty around COVID, and I don’t feel comfortable staying invested during these unpredictable times. I’d like you (Human Investing) to help provide me with a more conservative investment recommendation.”

Before I respond with market research, I want to reiterate that you aren’t alone with your concerns and fear. We hear you. At the same time, before making any decisions related to your portfolio, take the time to think through all the angles of your decision. The rest of this post will hopefully provide some anecdotes in your process. Here are few thoughts about what it looks like to plan for the end of 2020 and into 2021. Remember, it is better to plan than to speculate.

The correlation between your Politics and Your Portfolio

Generally speaking, there is low correlation between political parties and the stock market. However, that statement is easy to say and difficult to live out in practice. Tread lightly when reading articles that try to align which stock/sectors to own with the political party that takes office. This article from 2016 couldn’t have been more wrong prognosticating that energy companies (specifically Exxon Mobile) would be top performers for the proceeding four years. It goes without saying this was a massive miss.

stock-and-sector-returns-since-2016.jpg

The bigger influence: Are you a speculator or planner?

If you think like a speculator, you will make rash decisions around your investment accounts and have no plan for re-entering the market if you move your dollars to cash or to a conservative investment.  

If you think like a planner, you will use both quantitative and qualitative measurements to evaluate your decision. For example:

  • If you have a long-term horizon (greater than 15-20 years), political changes should not impact your investment decisions.

  • Irrespective of the political environment, review if your account is too aggressive or too conservative for your financial landscape.

  • Have a clear understanding of both candidate’s tax policies. Changes to the federal tax code should be a factor in your financial planning for the remainder of 2020 and into the future. If you are working with a CPA and/or Financial Advisor, make sure they are staying abreast with any impactful tax code changes.

annualized-asset-class-returns-presidents.jpg

Ditching The Market

Trying to time the market when negative news arises (or the anticipation of negative news) is a dangerous game to play. Luckily, we have a recent case study of how dangerous it can be. From January 1st to March 23rd, the stock market fell 30%. Since then, the market has recovered all losses and then some. If you were thinking like a spectator, it would have been easy to create a narrative around mid-March to pull your money out of the market and wait for greener pastures. If an investor did so, most likely that investor is still waiting for the market to dip and has missed out on the recent recovery as indicated by the second chart.

sp-500-returns-2020.jpg

If you think like a planner when the market is more volatile, sometimes taking some form of action itches a behavioral scratch. Here are some ways to take action while not compromising your account:

  • Raise your contribution in your retirement account to take advantage of a decreasing market (buying more shares at discounted prices).

  • Open a small “fun money” account to track if your predictions are correct.

  • If the market does significantly drop, look at converting pre-tax dollars to ROTH.

The concept of thinking like a speculator vs. thinking like a planner represents the cultural moment we are living in right now.

Speculating = headlines, fast moving social media, and the potential for instant gratification.

Planning = well thought out strategies that take time and often require no action.

As we head into this season of elections and COVID uncertainty, I hope this post provides some perspective on how to approach your portfolio. As always feel free to reach out to our team to talk through your thought process. We are happy to help!


Related Articles

Providing Sound Advice in a World of Robinhood Investing
 
scott-graham-5fNmWej4tAA-unsplash.jpg

One of the interesting subplots in the finance industry during COVID-19 has been the rise of the day trader. Robinhood, an online brokerage and trading platform, acts as a proxy for many investors who are rapidly opening accounts at other brokerage firms including Charles Schwab, E*T, TD Ameritrade, Fidelity, etc.

Our firm works with thousands of employees via their company-sponsored retirement plans and has had many conversations end with a question/comment along the lines of, “What do you think of this Robinhood thing? Is it worth putting some money in there? Seems like (fill in the blank tech company) is making money! Should I buy some?”. So, I felt compelled to address the question(s) and provide some context around where a speculative trading account fits into a greater financial plan.

THE MAJOR PLAYERS

Source: Piper Sandler

Source: Piper Sandler

E*TRADE: more users opened accounts in the month of March than any full year on record.

Charles Schwab: 1 million new accounts so far in 2020.

Robinhood: 3 million users opened accounts in Q1 2020. For perspective, there have been 13 million accounts opened at Robinhood since its founding in 2013.

The GROWING appeal OF DAY TRADING

The barrier of entry has never been lower to open an account and buy shares of publicly traded companies. Because many individuals are at home, trading is as cheap and accessible as ever, and some firms have incentive offerings (like a free share of stock when you open an account). Pair that with the stock market reaching its low point for the year on March 23rd and having one of its fastest recoveries ever (in other words the last 5 months have been a winning proposition for many investors), and you get to the point where we are today.

YCharts1.png

Today could be a euphoric place for an investor owning stocks since March. To me, euphoria looked like TMZ coming out with a trading subscription service… yikes. Stocks have only gone up, and popular tech companies have led the way. Kudos to those who might have doubled their money on a company like TESLA, but the last 5 months do not paint a realistic picture of what investing looks like over the long haul.

the emotional rollercoaster of Owning single stocks

When talking about owning a single company, I like this example. Owning a company like Amazon over the last 10 years seems like a no brainer (today). If you had invested $10,000 10 years ago, it is worth over $268,000 today. However, when you see that over the last 10 years, an investor would have had to hold through down periods of -25% over 5 times to get to where the stock is today. In other words, the stock was down 25% of its high over 5 times. Holding a company through those periods can be difficult, emotional, and in my opinion, is an objective way of capturing what owning a stock (even one that has performed as well as Amazon) is like.

AMZN_chart (2).png
AMZN_chart (3).png

Investing advice for smarter day trading

Whether you are someone who has already played around, are thinking of dipping your toe in the water, or your ego is already as big as ever because you’ve been a successful trader for the last 5 months, here is some advice on what it looks like to invest in your long-term plan vs. speculating.

Boundaries, Boundaries, Boundaries: If you are going to buy a stock on your own, don’t have it impact your overall investment strategy and long-term plans. What does that mean? Invest a dollar amount that you would feel comfortable taking a 100% loss on.

A positive outcome can mean… many things: Recently the Winklevoss twins (yes those Winklevoss twins) were quoted saying that Elon Musk is going to mine gold on asteroids orbiting the Earth, thus decreasing the value of gold and increasing the value of bitcoin (I promise this isn’t fake). One scenario is that their theory is wrong but in the next 5 years, owning bitcoin could be a profitable trade. In the same light, if you have owned a technology company or a fund that tracks technology companies since March, you have probably made money. Does this make you the next great market predictor? Most likely not. At Human Investing, we have a saying "process over results". So, in these situations, whether or not your account is checking up on your process is equally or more important.

Trading Journal: If you are seriously interested in the market and having a brokerage account, a trading journal is imperative. If you have a prediction, write it down, track it, and review your track record. It’s not a bad idea to do this for a few weeks to test the waters before you open an account.

Small Losses Can Lead to Long-Term Positive Outcomes: Here’s a hypothetical, stay with me. You read this post, you open an E*TRADE account, and deposit $200. You end up buying a few stocks and start following the market. You are following investing influencers on social media, listening to podcasts, and even watching CNBC in the morning. Then life happens. You get a little bored, lose track of your password, reset your password, and lose track again (this version of you doesn’t have LastPass 😊). Six months go by, and you see that your $200 is now $50. As a byproduct of this experience, you realize that you are better off opening up a ROTH IRA at Vanguard contributing $100 a month into an age-based target-date fund because you now care more about retiring comfortably. Your $150 loss on your account made you realize:

  1. You are not interested in picking stocks and it isn’t easy.

  2. You educated yourself about the market, the benefits of a ROTH IRA, and moved the needle on helping yourself retire.

Time will tell if this Robinhood movement is a fad or a long-term trend. Either way, if you have questions, want to grab coffee via zoom and talk markets, or talk longer-term planning, our team is here to be a resource.

Other Articles You Might Enjoy On This Subject

* Inside Story On Robinhood

* WSJ video on Robinhood


Related Articles

My Personal Three C’s Of The Week: Controllables, Crisis, Charity
 

My older daughter Norah (2) speaks part English part “Daniel The Tiger”. Walking around our house she will randomly shout statements like, “ I don’t meow, have to meow” (we are obviously doing great as parents) or something easier on the ears like, “I love you just the way you are Daddy”.

The volatility we are seeing in the markets, as it relates to day to day swings, has not been seen since the late 1920s. Between the volatility, we are seeing in the markets and the effects of the Coronavirus socially and on local businesses, it seems like we are in for quite a ride. Today I found myself humming a timely Daniel The Tiger tune. Ultimately reminding myself to control the controllables and relax.

“Give a squeeze, nice and slow. Take a deep breath, let it go”

3 c's chart A.png

Whether you are working from home right now, finishing up at your place of work or are now forced into a home school teaching role, we all have a lot of thoughts going. Here’s how I’m processing mine:

Controllables:

This can apply to how we interact with others in the world however, I’m applying it to investing. As of the close today, the S&P is down 30% off its highs with individual companies we are all familiar with down much farther.

3c's chart.png

At our firm, we have strict rules and guidelines around rebalancing. After reading others’ research and conducting our own, rebalancing based on time (semi-annually, annually, etc.) and threshold (if a position becomes underweight or overweight compared to the rest of the portfolio) can greatly improve the risk/return characteristics of an investment strategy. It also incorporates a “buy low” “sell high” attitude and can feel like you are taking action in volatile markets while not succumbing to market timing.  Note that the use of an Investment Policy or a rebalancing policy is a must.

Lastly, rebalancing isn’t solely about buying low and selling high. Another key feature is managing your risk over long periods of time, especially if you are taking withdrawals. Michael Kitces has done multiple posts about this. The below chart tracked withdrawals over a 30 year period. You can see how during down markets the lack of rebalancing diminishes the portfolio.

Chart_WithWithoutRebal_ver3.jpg

Crisis:

A timely podcast from Patrick O’Shaunghnessy came out this week titled “Investing Through Crisis”. I wanted to be careful before using the word “crisis” in this post, but the definition seems to fit the times. The paper, written by the Dan Rasmussen the interviewee of Verdad Capital, was published in the Winter of 2019 and looks back on past periods of crisis and if there were any silver linings that could be taken from it. Here are some bullet points that I think we can help us today:

  • There is the expansion of the breadth of rational beliefs during times like this: Rasmussen goes on to point out that there is massive uncertainty around the worst-case scenarios and best scenarios and often the world can’t disprove either. This is a key metric in volatile markets.

  • Bear markets have more predictable movements than Bull markets: Human behavior (fear, worry, etc.) drive bear markets. What’s worked (the rationale behind a bull market) will vary case by case.

  • Market timing requires three unknown data points: Being correct on all three of the below data points is highly unlikely. 

    • You must decide what’s going to happen in the future

    • You must decide when to get out

    • You must decide when to get in

Charity:

I read this post that inspired me to take a step back and be grateful for what I have as opposed to what is uncertain. In Portland there are/will be many groups specifically impacted by the Coronavirus. After talking with a few local leaders, they substantiated that donating to these causes can have a profound impact:

-          Oregon Community Foundation

-          Oregon Food Bank

-          Meals on Wheels

-          American Red Cross


Related Articles

The Last 72 Hours - What's Changed & What's Stayed The Same
 

On Monday I wrote this blog post sharing our firm's thoughts on the current state of market volatility. If you haven’t read the blog I’d highly encourage you to do so. Candidly, writing that feels like 3 months ago as opposed to 3 days ago.

What’s Changed:

  • WHO declares Coronavirus a pandemic

  • President Trump declares a travel ban in the EU

  • Many Sporting Events are canceled or postponed

  • For Oregonian’s, Governor Brown cancels events over 250 people

  • Universities and School Districts go online or close for periods of time

  • A well-known celebrity, Tom Hanks tests positive for Coronavirus

  • Lastly, the stock market has gone from being 18% off its highs on Monday to 26% off its highs as of the market close today (Thursday, March 12th). Along the way, it suffered it’s worst single-day loss since 1987.

High.jpg

When speaking with a co-worker Wednesday night it seemed like there was a social tipping point for many Americans regarding the potential seriousness of the virus. It felt closer. Add in what’s happening with the price of oil and interest rates and you get the fastest move from a market high to being in a “bear market”.

bear.jpg

What’s Stayed The Same:

A quote I’ve been thinking about this week is, “There’s an art to taking action and an art to justifying inaction”. Another piece of information that was shared today in our office was “In volatile times like this its necessary to be more disciplined not less discipline.” The same principles still apply to being a great investor today as they did a month ago. It’s simply harder to execute when chaos is occurring around us.

As hard as is it is, most likely inaction is the best course during times of increased volatility. It’s common for some of the best days of the market to be close in close proximity to some of the worst. Here’s what happens when you miss out on some of those days.

Missing.JPG

Going to cash and getting back in when it feels better is harder than it sounds. This quote from Josh Brown a CNBC pundit and CEO of Ritholtz Wealth Management provided this perspective from March of 2009 (the bottom of the financial crisis) and what it looked like to get back in:

The great answer is that you won’t know when the dust settles. There’s no airplane writing the “all clear” in the sky above your neighborhood. And when the dust settles, do you think stocks will be at their lows? Or will they have already rallied furiously, in anticipation of this? Let me give you an example. Imagine it’s March 9th. About eleven years ago, in 2009, the stock market stopped going down. There was no reason. The dust had settled, without fanfare or any sort of official announcement. If you had polled people that day, or week or even month, most would not have agreed that we had seen the worst. The economic headlines were not improving. But there it was. And by June 12th, about 3 months later, the stock market had climbed 40% from that March low. And even with that having happened, the majority of investors still weren’t clear that the dust had fully settled.“

Market.JPG

Do you what you need to do to make it through times of increased volatility in the market. I heard the term “social distancing yourself from your 401(k)” and it provided a much-needed laugh. Having discipline and staying the course on your plan is much easier when you have a plan. Whether it’s using your own tools or entrusting a fiduciary to partner with you, knowing that you did the planning work upfront makes all the difference in when 3 days feels like 3 months.


Related Articles

Market Volatility - The Cost of Admission
 
Buffett.jpg

I read two bite-size pieces of content last week that equally affected me:

“The whole reason stocks tend to do well over time is because they make you put up with stuff like this. It’s the cost of admission. A feature, not a bug” – Morgan Housel Collaborative Fund

“Telling people to ignore the noise is telling people not to be people” – Michael Batnick Ritholtz Wealth Management

As an advisor to families, endowments and corporate retirement plans our firm lives in the tension of these types of statements often. The ability to substantiate recommendations with facts, as opposed to noise, while recognizing each client that we work with has a unique set of circumstances hopefully validates our name Human Investing.

Our team (probably like you) is learning, reading and writing about the set of current events.  Like Housel and Batnick mention, it’s a combination of having perspective (in other words we’ve been here before) and recognizing that each time the market flirts with “correction” territory it’s a reasonable behavior to feel uncertainty.  We find the charts, statements, and questions listed below helpful when talking to clients and hope you do as well.

For most people, this is a price of admission scenario:

Today was the 17th worst day for the S&P 500.  Since 1825 the US Stock Market has returned nearly 10% per year. The below histogram does an excellent job of showing how those returns are plotted over the last 195 years. Like we mentioned above, investors do not receive excellent returns without taking on risk. Days like today are the price of admission.

histogram.png

“But this time it’s different”

You’re right this time it is different due to the speed of the market declining and the intersection of COVID-19, oil prices steeply declining and the federal reserve lowering interest rates. Not to be dismissive of the current world events, but it’s different every time. It was different during the dot com bubble and the 2008 financial crisis as well. These visuals help provide perspective regarding the current volatility we are seeing and what’s normal.

A.  Drawdowns in the market happen all the time. This current drawdown is around 18% (so far) which is slightly below the normal intra-year drawdown of nearly 14% since 1980.

percent off high.jpg
Vol is normal.jpg

B. These charts show that while the speed of this drawdown is occurring faster than normal. The fact that we are experiencing volatility linked to world events occurs more often than we might initially think.

quick down.jpg
world events.jpg

“Buying into this market seems terrifying should I go to cash (or stay in cash if applicable)?”

Two scenarios come to mind:

A.  You’re fully invested right now: Market timing is rarely (most likely never) a good idea. This is where knowing yourself as an investor and the qualitative side of the equation matters as much as the data. If slightly reducing how aggressive you are will allow you to sleep at night and not press the “sell all” button then consider strategies along those lines that lead to better long term outcomes. Otherwise, stay the course.

B. You’re in cash right now and waiting for an entry point: Consider this scenario. Over the last 20 years, the worst day to invest in the S&P 500 was April 7th, 2000. As the chart below shows $10k invested then is worth around $27k today. However, it took until December of 2013 (over 13 years!) for the $10k to be made whole on the initial investment and never look back. It’s a good case study for the recent worst-case scenario of investing in stocks and more specifically investing a lump sum of cash.

Capture.PNG

What’s tomorrow, this next week, this next month have in store for investors? Carl Richards said it best, “Are you concerned about days or decades?” Investing calls for a long term approach. Let’s take a page out of Warren Buffet’s book and get back at it tomorrow.

Be fearful when others are greedy and greedy when others are fearful
— Warren Buffett


Related Articles

Investment Strategies At Different Points In Your Life
 

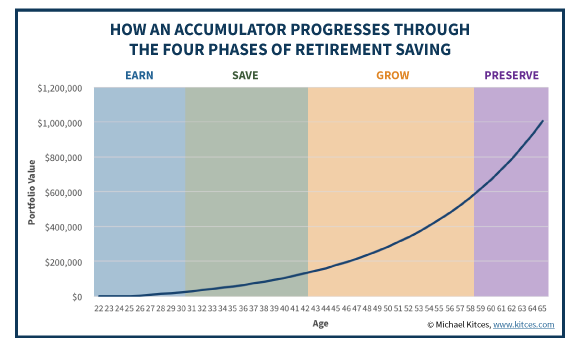
A blog that our advisors frequent is https://www.kitces.com. On the surface, the structure of the site may look a little unconventional, but after spending some time at the site you will realize that this guy really knows his stuff. One of his recent articles struck a chord with me. Kitces speaks to all the phases of investing and how each “moves the needle” when it comes to saving for retirement and creating an income to supplement a desired retirement. The article breaks down your working years into 4 distinct phases: Earn, Save, Grow, and Preserve. Before I get into the phases let’s have the chart below (showing someone saving $300/month at 8% earnings spanning from age 25 to age 65) guide us through the phases.

Graph-for-Andrews-blog-Aug-1-2017.png

Something that stood out to me in the article was how powerful savings is at the beginning of retirement and how impactful an appropriate allocation is towards the end of your working years.

Consider these two scenarios:

Regardless of whether you are 25, 35, or 45 if you are just starting to save what matters even more than the allocation is how much you are contributing. Imagine if you have an account balance of $1,000 and contribute another $1,000 over the course of the year. With a $1,000 contribution you’ve doubled your money (or grown your balance by 100%). In contrast, if you were to have an above average year of performance, say 10% rate of return, but did not contribute to your account balance you would have grown your account $100. While $100 is nothing to dismiss, we can hopefully agree that it's not going to impact your retirement in a drastic way. Later on in life as your balance grows that 10% return will have a much greater dollar impact, but during the early phases of saving your contributions do most of the heavy lifting when building your account.

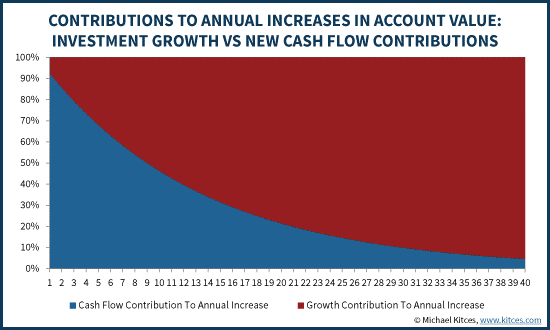
As you continue to work and save the pendulum will slowly swing from contributions having the most impact on your account to account growth (or capital appreciation) impacting your account. The below chart (again from Kitces) gives a representation of the importance your allocation has as you progress in your career.

Graph-2-for-Andrews-blog-Aug-1-2017.png

As you can see there is truly a shift in what influences your account most over time. Let’s look at that same $1,000 contribution later in life. Assume you’ve been saving for 20 years and your retirement account has grown to $250,000. The same $1,000 contribution now has less than a 1% impact on your account with the 10% rate of return on your account doing the heavy work to increase your account value by $25,000 (keep in mind a negative 10% return has the same impact on the opposite end of the spectrum).

So where do you go from here? Your savings rate and your allocation are going to impact your account value throughout the course of your working years with each providing great impact at different times during the course of your savings life. In fact, on average after saving in an account for 20 years, market growth accounts for 75% of increases in your account! A great rule of thumb is if you can pinch pennies in your 20s and 30s to build a great base in your account while keeping a growth allocation throughout your working years, you’re on your way to a successful retirement plan.

Call 5039053100

Email 401k@humaninvesting.com Sources

https://www.kitces.com


Related Articles

Is Your "Uncle Larry" Giving You The Best Investment Advice?
 

I’ve done it with a construction project at my house and maybe you’ve done it with your retirement account. Yes, I’m talking about going to Uncle Larry, the person who is never short on advice but not necessarily an expert. For those of you who aren’t tracking, “Uncle Larry” is a figurative yet all too real figure who is willing to give out advice about most anything, and we tend to eat it up. Even though Uncle Larry is a tongue-in-cheek character, the reality is I’ve seen the damage he or she has done to retirement accounts. I get it, finding sound unbiased advice isn’t easy and the deck can be stacked against investors when it comes to receiving it. The good news is there’s hope. While we can't always run away from unsolicited advice, we can be equipped with some perspective and good questions to ask. My hope is to provide an outline with some good questions and standards when it comes to receiving advice, regardless of whether it’s from a family member or professional.

What’s your track record?

  • This question might be a little awkward if you’re asking your sister-in-law at the Thanksgiving table, but it is a reasonable one if she is offering advice on your retirement plan.

  • Don’t be afraid to get specific! If it’s an advisor, ask for references. If it’s a family member, ask for last year’s statement!

What’s your process for a recommendation?

  • If all your older brother is doing is simply looking at what fund has performed best for the last 3 months, odds are you aren’t going to be in a good situation. Instead, looking at the funds expense ratio, or cost structure of the fund can be a great resource. The lower the expense ratio (relative to the asset class) the better the predictor of returns.

Is there a conflict of interest?

  • This question is more specific to the cousin who works as a stock broker. If the name of the company she works for is the same as the name on the mutual funds in your account, that’s probably not a good sign. Imagine if Pizza Hut was the judge of the country’s best pizza; that’s like asking for the best fund from someone who is compensated by the recommendation they are making!

So what do I do?

  • Ideally you have a personal financial advisor or an advisor through your retirement plan who aligns with your best interest, Registered Investment Advisor (RIA). It’s worth asking if your advisor is a “fee only” fiduciary who by law is required to act in your best interest.


Human Investing is one of many companies who act as a fiduciary to clients and plan participants. Note: that our official stance on receiving advice from a non-professional family member is not a best practice. However, if your Uncle Larry has given you advice and you would like a second opinion, we would love to help you. Please don’t hesitate to email or call!

Call: 503.905.3100

Email: andrew@humaninvesting.com


Related Articles

Identifying your investment risk
 

Our solution to identifying your investment risk… and why it matters

This past weekend my wife and I went and visited two of our best friends in the hospital who just had a baby girl. When we got the text that the baby had arrived, we were in line at the Nike employee store. As we got up the counter, my wife became teary eyed with thoughts of happiness for our friends, as you can imagine the check in person didn’t quite know what to do! The cool thing about being at Nike at that time, was that we were able to pick up this little number as a gift for the newborn, which I would highly recommend simply because it's awesome.

Later that night we went to visit them, and I had not been to a doctor’s office/hospital in a while, and while I was there noticed the “pain tolerance scale” up on the wall in our friend’s room.

This scale has always made me laugh as often times it is usually relative and doesn’t define what the parameters are. What signifies a 10 on the pain scale? A broken leg? Something more painful? I know for me it was crashing my bike and meeting the gravel face first.

This got me thinking about a financial scale that many of us have seen before called the “risk scale”. Most people who have invested before have probably been asked the question, “Are you more of a conservative, moderate, or aggressive investor?” And most people say some form of, “Moderate, I think? I obviously want to make money but don’t want to lose it all”. Similar to the pain tolerance scale, the question needs to be asked; what does conservative, moderate, or aggressive mean? This is a reasonable question many people have a hard time answering. Human Investing has recently partnered with Riskalyze, a company that looks to provide tangible risk information that investors can act on.

risk 2

risk 2

Here is how it works: After completing a simple risk questionnaire you are given a risk score from 1 to 100. This score acts as a benchmark (investor lingo for pain scale) and explains what to expect during different market conditions. For example, if you are invested in the S&P 500 your risk score is a 78 according to the assessment. It also shows you that generally in a given 6 month period of time you can expect a best case return of 28% and a worst case return of -18% with a historical average rate or return of around 9%. As the investor, YOU get to decide if you’re comfortable with that and can look at different investment options or portfolios that fit your goals and timeline best.

So why does this matter? Because over time investors typically under-perform the market due to things like lack of discipline, changing strategies, and trying to time the markets. We believe that a more informed investor who understands their risk and the upside and downside of their allocation can fair better. When I show this tool to 401k participants I often use the following sound bite to explain that most investors are emotional and have a short-term view; In 2014 the 20 year backward looking S&P 500 annualized return was 9.85% while the average US equity mutual fund investor annualized return was only 5.19%! Yes you read that right. Over a 4% difference per year the average investor missed out on.

Our hope is by equipping investors with information like this people can have a better understanding of which investment mix is best for them and how to stick to it over time. Thus, creating higher returns by increasing discipline.

If you are looking for an explanation about the pain scale, I am just as confused as you and probably can’t help. But, if you would like to have a conversation about your risk score and how to implement it, don’t hesitate to email someone from our team or give us a call!


Related Articles

An Additional Tax Credit
 

Retirement Savings Contribution Credit (Savers Credit)

For anyone who has made a contribution to a retirement account in 2015 or is considering contributing in 2016, you might be eligible for an additional tax credit. The Retirement Savings Contribution Credit, also known as the Savers Credit, is a special tax break to low and moderate income taxpayers who are saving for retirement. This credit, in addition to other tax benefits for saving for retirement, can reduce or even eliminate your tax bill if you qualify.

Interestingly enough, a recent survey showed that only 12% of American workers with annual incomes of less than $50,000 are aware of the Savers Credit. In other words, the population that should know about this Savers Credit the most is under-informed. With hopes of raising awareness and equipping savers on how they could potentially pay less in taxes, see below for a brief Q&A on the Savers Credit on how it works and what you should know.

How much could the Savers Credit cut from my tax bill?

You can claim the credit for the 50%, 20%, or 10% of the first $2,000 you contribute to a retirement account depending on your adjusted gross income and tax filing status. Note that the largest credit amount a married couple filing jointly can claim together is $2,000 and the credit is a “non-refundable” credit. This means that the credit can reduce the taxes you owe down to zero, but it can’t provide you with a tax refund.

What retirement accounts qualify?

The Savers Credit can be claimed for your contributions to a 401(k), 403(b), and 457 plan, Simple IRA, Traditional IRA, and ROTH IRA. Note that you cannot claim any employer contributions to employer sponsored retirement accounts.

Am I eligible?

In order to claim a Savers Credit you must be:

  • Age 18 or older

  • Not a full-time student

  • Not claimed as a dependent on another person’s return

Additionally you must meet the necessary income requirements. In 2015 the maximum adjusted gross income for the Savers Credit is $61,000 for a married couple filing jointly, $45,750 for head of household, and $30,000 for all other filers. The maximum credit you can claim phases out as your income increases. See the below table that outlines how much you can claim and at what income levels:

2015 Saver's Credit Credit Rate Married Filing Jointly Head of Household All Other Filers 50% of your contribution AGI not more than $36,500 AGI not more than $27,375 AGI not more than $18,250 20% of your contribution $36,501 - $39,500 $27,376 - $29,625 $18,251 - $19,750 10% of your contribution $39,501 - $61,000 $29,626 - $45,750 $19,751 - $30,500 0% of your contribution more than $61,000 more than $45,750 more than $30,500

This information can also be seen at on the IRS website. If you are eligible use the Form 8880 to claim your credit and other best practices.

Example:

Dan and Kailey are married and file jointly. He contributed $1,000 to his 401(k) and she contributed $500 to an IRA. Their 2015 combined AGI is $35,000. Therefore, each of them is eligible to claim a 50% credit for their contributions and together their credits are worth $750.

If you have questions on if you are eligible for the Savers Credit feel free to email or call us and we would be happy to walk you through this blog post in more detail and how you can best take advantage of this credit.


*Please note that Human Investing does not provide tax advice/guidance and you should contact your CPA with specific tax related questions.


Related Articles

Making the Most of Your Social Security Benefit
 

The more I work through financial planning scenarios with individuals and families the more I realize how important it is to have a clear understanding of your social security benefit. A study in 2014 showed that 55% of retirees defined social security as their main source of retirement income and 88% responded saying that social security would need to be a steady source of income in order to meet retirement goals. These numbers make perfect sense due to longer lifespans, increased healthcare costs, and corporations using 401k accounts rather than pension plans. Now more than ever, it is becoming necessary to have a steady stream of income that has the ability to last the rest of your life.

The goal of this post is simple; equip you with tools on how to best take advantage of your Social Security benefit. See below for three things to consider when looking to get the most out of a program you’ve been paying into your entire working career:

1. The Waiting Game

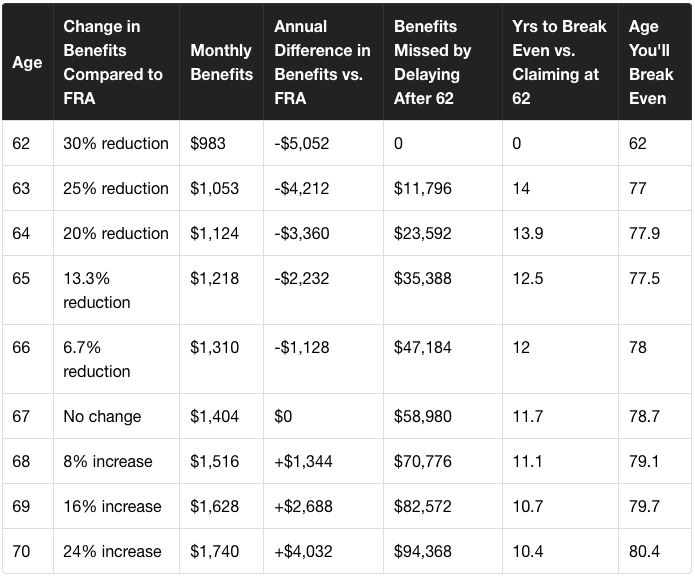
Generally speaking, you’re eligible to receive 100% of your Social Security benefit at your full retirement age (FRA) which is currently between the ages of 66 and 67. If you decide to claim before your FRA, the benefit amount will be reduced. For each month you delay claiming Social Security your benefit increases until you reach age 70. If you were born between 1943 and 1954 here’s an illustration that provides some context to your benefit percentage:

Social Security.png

Notice that between your FRA and age 70 your benefit increases at a rate of 8% per year. This is risk free rate of return that you receive just for delaying your benefit. Note that investors in the stock market who have the potential to lose 10% of their money in a given week are very pleased with an 8% rate of return in a given year!

2. Finding Break Even Points

Once you have an understanding of why it might make sense to wait to take your benefit, combine that with a knowledge of your personal health and family history, and you're ready to make an educated guess regarding when to take your benefit. Below are a couple key numbers to keep in mind.

Between 77 and 78

Is the age where an individual who files at FRA today catches up and exceeds the age 62 filer in total money collected. Also remember that the FRA filer has higher monthly payments going forward so the gap is only going to increase.

Between 80 and 81

Is the age where an individual who files at age 70 catches up with and exceeds the age 62 filer in total money collected.

Between 82 and 83:

Is the age when the age 70 filer catches up with and exceeds the FRA filer in total money collected. Many variables can factor into these equations such as; taxes, employment status, and other financial considerations. While I encourage you to dig into these calculations on your own, make sure to consult a financial professional (like Human Investing) when making these decisions.

3. Additional Income and Social Security

While there are many things to consider when filing for Social Security don’t forget how other income affects your benefit. Many people that I've spoken with about this issue commonly confuse "keeping" your benefit at FRA vs. "being taxed on" your benefit at FRA. The short of it is once you reach FRA you can keep all of your benefits, but you can also be taxed on those benefits contrary to what some people think. See below for a summary on the differences between keeping your benefit and being taxed on your benefit when accounting for additional income:

  • If you work, and are full retirement age or older, you may keep all of your benefit, no matter how much you earn. If you’re younger than full retirement age, there is a limit to how much you can earn and still receive full Social Security benefits. If you’re younger than full retirement age during all of 2015, the government must deduct $1 from your benefits for each $2 you earn above $15,720. If you reach full retirement age during 2015, the government must deduct $1 from your benefits for each $3 you earn above $41,880 until the month you reach full retirement age. This brochure provides some additional commentary on how working income factors into your benefit.

  • Some people have to pay federal income taxes on their Social Security benefits. This usually happens only if you have other substantial income (such as wages, self-employment, interest, dividends and other taxable income that must be reported on your tax return) in addition to your benefits. This link provides some more details on the taxes you pay on your social security when factoring in other income. Lastly, this web page gives the best example I've seen when factoring in taxes and Social Security.

By looking at the advantages of waiting to take your benefit, some break-even points, and tax strategies for social security hopefully you see that it takes time and effort to make the most of your benefit. It’s possible to literally leave tens of thousands, if not hundreds of thousands of dollars on the government's table if you’re not thoughtful in how you receive this benefit.

So, if you have questions on your Social Security benefit and how it affects your retirement timeline, feel free to email or call Human Investing at any point. We’d love to partner with you in making the most of this benefit.


Related Articles