Posts in Managing your Portfolio
Test Your Financial Literacy With These 5 Core Questions
 

The financial world can be a confusing place filled with jargon, technicalities, and little to no guarantees. Research suggests that those who are financially literate tend to have better financial outcomes. Financially literacy is typically measured by asking some core financial concept questions. Let’s walk through some financial literacy questions from the National Financial Capability Study, and explain the why behind the answer. Feel free to guess and score yourself at the end:


Question 1 - interest:

Suppose you had $100 in a savings account and the interest rate was 2% per year. After 5 years, how much do you think you would have in the account if you left the money to grow?

A. Less than $102
B. Exactly $102
C. More than $102


Answer: C, more than $102.

Explanation: The key part here is “After 5 years”. We are told the interest rate is 2% per year. That means every year, 2% gets added to our principal balance. To break it down year by year:


q1 copy.jpg

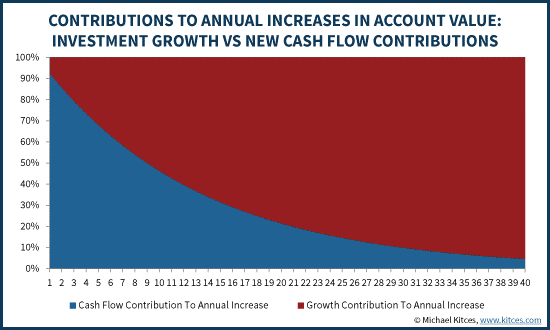
The interest earned increases each year. This is due to compound interest: the original principal ($100) grows, and the interest you earned previously (in year 2, $2) both earn interest. At the end of 5 years, we have $110.41 which is C More than $102.

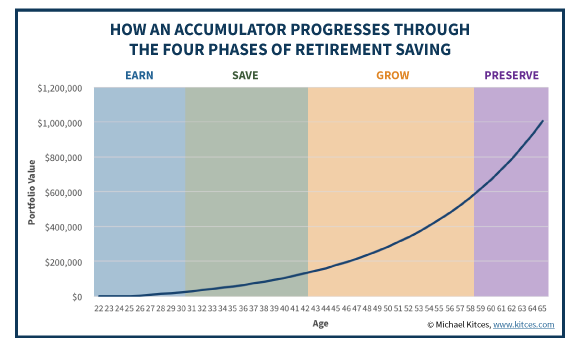
Why this matters: Interest affects you when you save money to grow it, or borrow money to pay it back later. Knowing how interest can work for or against you is critical for financial success.

Question 2 - inflation:

Imagine the interest rate on your savings account was 1% per year and inflation was 2% per year. After 1 year, how much would you be able to buy with the money in this account?

A. Less than today
B. Exactly the same
C. More than today


Answer: A, Less Than today.

Explanation: They key here is the inflation rate is higher than the savings rate. Inflation is growing at 2%, meaning the price of goods (rent, utilities, food, cars, etc.) is going up by 2% each year. The cost of $100 of goods today will be $102 in 1 year. Your interest on savings is growing at 1% a year. That means in 1 year you will have $101 to spend on goods. In 1 year, you will have $101 to buy $102 worth of goods. Your ability to buy is A less than today.

Why this matters: Even if you keep your money “safe” in the bank or under the mattress, inflation is going to make that money less and less valuable. Thus why investing is so important. Investing can be scary due to downturns in the market, but ultimately the odds are in your favor to grow your money over time. Unless you can save significant portions of your income, growing your savings faster than inflation is critical for being able to retire.

q2 copy.jpg

Question 3 - Risk Diversification:

Buying a single company’s stock usually provides a safer return than a stock mutual fund.

A. True
B. False


Answer: B, False.

Explanation: To answer this question correctly, it is important to understand both risk and that a mutual fund owns a variety of companies. They keyword here is safer. Financial markets have two types of risk: market risk and company-specific risk (aka systematic risk and nonsystematic risk respectively).

Market risk refers to risk all companies face. Examples of market risk include a change to the US tax code, a global pandemic, or shifts in consumer tastes like a shift from fast food to organic freshly prepared food. You will always face market risk because every company is exposed to these risks. Company-specific risk refers to risks unique to one company. Examples of company-specific risk include sudden changes in management, a press release about product defects, mass recalls, or a superior/cheaper product released by a rival company. Because you own a variety of companies in a stock mutual fund, you diversify away (i.e. reduce your risk) if any single, specific company has a terrible event.

Why this matters: Don’t invest all your money in one company. Especially if you work for that company, and your compensation is based on the company doing well. By spreading out your investments, you reduce your risk of catastrophic returns, and smooth out the ride so you can sleep at night.

Question 4 - interest of the life of a loan:

A 15-year mortgage typically requires higher monthly payments than a 30-year mortgage, but the interest paid over the life of the loan will be less

A. True
B. False


Answer: A, True.

Explanation: Because of the shorter life of the mortgage loan, you pay less interest. Remember in question 1, interest compounds every year. When you borrow money, that compounding works against you. Therefore, the faster you are paying off debt, the less time for interest to compound and grow the total amount you have to payoff. The monthly payments are typically larger, but the overall interest paid is less.

To illustrate with numbers, let’s look at the difference between a 15 year & 30 year mortgage, assuming a 5% interest rate for both:

q3 copy.jpg

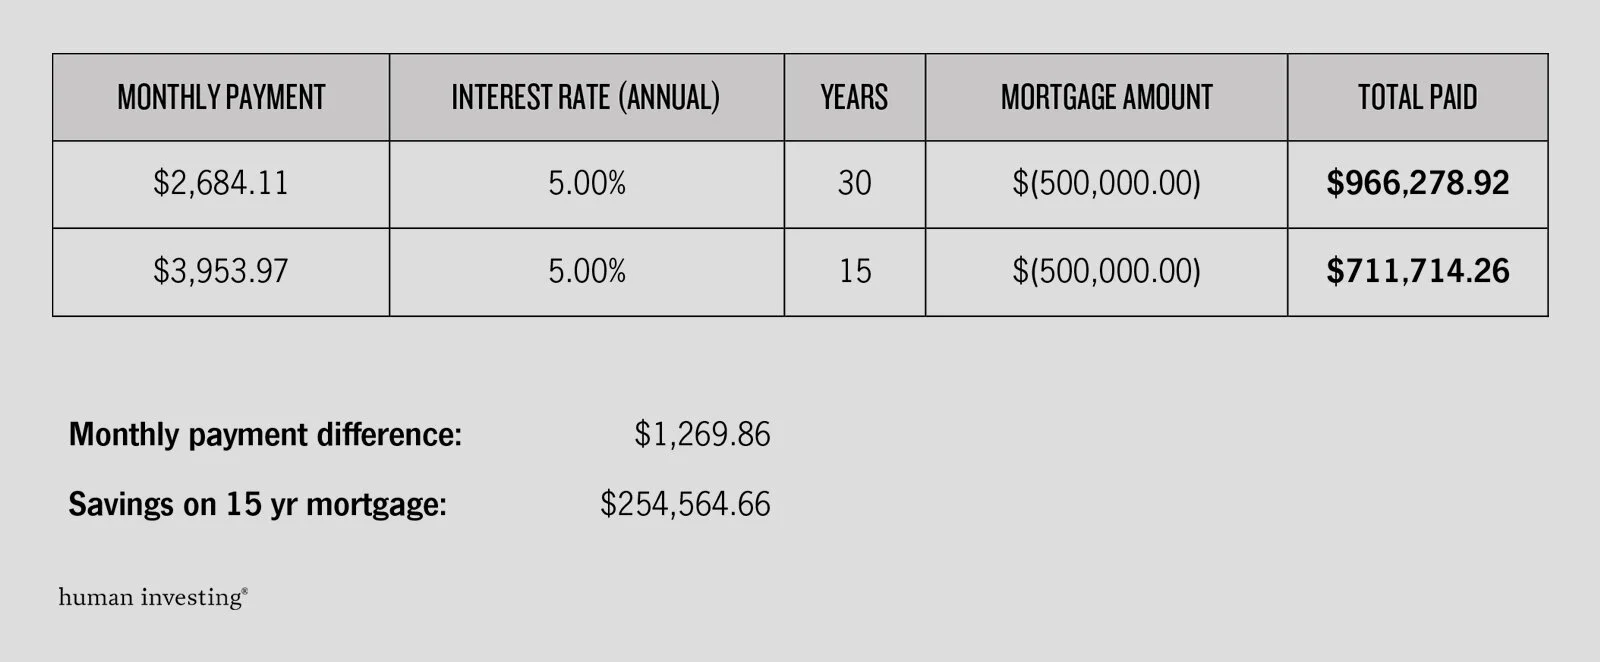
Why this matters: You can see from the example how much money is saved by opting for a 15 year mortgage. Can you afford that extra monthly payment? That’s worth investigating, but you’ll never explore your choices if you don’t know what they are. You can also usually get a lower interest rate for shorter term debts, which saves you even more money. Anytime you borrow any amount of money, the faster you can pay it off, the less you will pay total. Even if you don’t get a lower rate on the debt, if you pay off the principal sooner, that means there’s less interest compounding against you. When looking to borrow money, evaluate what term (length of time) works best for you and your budget. You want to minimize your cost of borrowing, but you also want to give yourself enough flexibility that you’re confident you will make all those payments on time, regardless of what life brings.

Question 5 - Bond prices and interest:

If interest rates rise, what will typically happen to bond prices?

A. They will fall
B. They will stay the same
C. They will rise


Answer: A, they will fall.

Explanation: This is the question most people get wrong. A bond is government or corporate debt. The government or company pays you coupons (interest payments) based on the issued interest rate. At the end of the bond’s life, it matures, and you get the principal back.

Imagine Disney issues bonds paying 5% interest, the current market rate. You purchase a bond for $1,000, and you get a $50 coupon payment from Mickey Mouse every year until the bond matures. If interest rates rise next year (say to 8%), and Disney issues new bonds, they will issue them at the new interest rate. Your neighbor Laura decides to buy $1,000, and she gets an $80 coupon from Mickey Mouse every year. Because interest rates rose, the value of your bond paying $50/month goes down in value, less than $1,000, because the $1,000 could buy Laura’s bond paying $80/month. The reverse if also true. If rates had fallen to 3%, Laura’s bond would only pay her $30, and your $50/month bond would be worth more than $1,000.

Why this matters: Interest rates change over time. This causes bond prices to change. Bonds will still be less volatile than equities, but they do also fluctuate in value. Don’t panic when you see interest rates rise, and your bond prices going down in value. This is both normal and expected. Rising interest rates are also usually a healthy sign for the economy, and so your equities will generally be rising in value to help offset the loss in value of your bonds. The reverse is also true here. Falling interest rates tend to indicate a less healthy economy (think about when rates have dropped significantly & quickly; the 07-08 financial crisis and COVID-19) which means falling stock prices. Because they don’t tend to move together (uncorrelated), bonds and stocks are an excellent pair for smoothing out your investment returns.

How did you do?

If you got some questions wrong, I hope you understand the why behind the answers and how to utilize this knowledge to better your financial life. If you have questions about financial vocabulary or systems you’d like me to blog about, please email me at andrewg@humaninvesting.com. If want to talk to an advisor, please email us at hi@humaninvesting.com.


Related Articles

Maximizing the Effects of Trade Wars
 

Do trade wars have an impact on the economy and market? The simple answer is…

It depends (Freeman, 2004).  Krishna, Mukhopadyay, and Yavas (2002) determined that free-trade can hurt the economy when capital markets are distorted.  While at the same time, trade can positively impact the economy when labor markets are in equilibrium.  Whether you are a free market zealot or, believe globalization was an experiment gone wrong, this trade war is not just about trade and tariffs.  It is a part of a much larger conflict between the U.S. and China, which in addition to trade/tariffs, encompasses politics, ideology, and even the current global geopolitical order.

In our view, regardless of the outcome of the current trade negotiations, this is just one chapter in a book that will continue to be written over the decades to come. Anyone looking for a neat and clean expeditious resolution will likely be disappointed. The uncertainty surrounding this conflict will continue for a long time and is out of our control. 

So, what can be agreed upon and has strong academic roots?

What appears to be universally accepted is policy to eliminate deficits, maintaining market-oriented exchange rates, improving the education system, strengthening the legal system, and increasing competition amongst domestic firms (Baldwin, 2003).  These are essential economic considerations both now and into the future—and what will move the needle long term for our economy, our markets, and our country.

How can you prepare for what happens? Having a Financial Plan.

At Human Investing, we emphasize comprehensive financial planning (we call this hiPlan™), which is very different from traditional planning, which tends to focus on a single area such as investing or insurance. By taking a comprehensive approach, we can create stress-tested, long -term, adaptive plans for our clients and gaze beyond the short-term implications of news headlines.

Further, we work as a team to serve our clients.  Much like a peloton where each team member jumps out front to take the lead when appropriate, we've assembled a team of financial planning experts—each with specific knowledge that our clients can leverage for their benefit.  So why are we so focused on financial planning?  For us, the answer is simple, empirical evidence points to its advantage, and we have personally seen it work for the clients we serve.   

Several studies have shown that individuals and families who employed the financial planning process enjoy greater wealth during retirement versus those who fail to plan (Hanna & Lindamood, 2010) (Van Rooij, Lusardi, & Alessie, 2012). As a non-commissioned, fee-only firm, we can provide the most objective and independent advice, making it more feasible to optimize the financial well-being of our clients. We believe that by working with our expert team and taking a long-term and comprehensive approach to financial planning, our clients can have peace of mind regardless of the headline of the day.

Have you started your plan today?

If not, or, if you are interested in learning more about our people and process, please call us at (503) 905-3100 or let us know about your needs.

References

Baldwin, R. E. (2004). Openness and growth: what's the empirical relationship?. In Challenges to globalization: Analyzing the economics (pp. 499-526). University of Chicago Press.

Freeman, R. B. (2004). Trade wars: The exaggerated impact of trade in economic debate. World Economy27(1), 1-23.

Hanna, S. D., & Lindamood, S. (2010). Quantifying the economic benefits of personal financial planning.

Krishna, K., Mukhopadhyay, A., & Yavas, C. (2005). Trade with labor market distortions and heterogeneous labor: Why trade can hurt. In WTO and World Trade (pp. 65-83). Physica-Verlag HD.

Van Rooij, M. C., Lusardi, A., & Alessie, R. J. (2012). Financial literacy, retirement planning and household wealth. The Economic Journal122(560), 449-478.


How to Avoid the Negative Compounding Effect of Fees on Your Account
 
leaky-bucket-fees.jpg

Despite the recent awareness around fees in today's environment, it can still be challenging for investors to know what and whom they are paying.

I was reminded of this recently when we had the pleasure of welcoming a family in as new clients to our firm. When they first reached out to us, they knew something was not right with their investment situation. After reviewing their statements and a discovery call, we quickly found out why. They were being overcharged and underserved. It turns out their fees were roughly 2.12% per year. At the same time, the level of service they were receiving included one phone call per year, online access and statements.

In this article, my goal is to unwrap the fee structure that this family experienced, highlight the long-term negative impact and then provide an awareness that can help you avoid this situation.

Moreover, while this article focuses on the experience of a single family, we have seen the same cost structure apply directly to institutions as well, whether an endowment, foundation, ERISA retirement plan or other types of institutional assets.

The step-by-step on how to give up 25% of your market returns to your advisor (not recommended!)

The family mentioned above did not realize they were charged fees on fees. One layer included an advisor fee of 1.40% per year with limited services. Unfortunately, industry expertise, full client engagement, risk management, along with estate and financial planning were not part of the offering. 

The second layer of fees was the underlying costs of the investments held in the portfolio—which was new information to the clients. Even though they had a diversified mix of “institutional” mutual funds in their account, the average expense ratio of these investments was 0.72%, which was added to the 1.40%.

 Without digging deeper into other potential underlying fees such as trading costs and custodial fees, the total costs were 2.12% per year. (1.4% + 0.72% = 2.12%)

Assuming a 9% long-term average return(1) in the stock market, these clients had been giving up almost 25% of return per year in fees. Unless there is some other form of benefit or return the client is receiving, this is retirement money down the drain. In Peter Fisher’s 2018 article in Forbes titled, “Why Conflicting Retirement Advice is Crushing American Households,"(2) he points out that the annual cost of conflicted investment advice in the US is $17 billion per year. The scenario outlined in this article is case in point.

The Negative Compounding Effect of Fees

The diminishing effects of the high fees & low service model outlined above are significant. To illustrate, I have provided a compare-and-contrast to what I believe is a more reasonable fee structure of 0.85% in total fees. (This includes an advisor fee of 0.75% and underlying investment fees of 0.10%.) 

After backing out the fees for both scenarios, the difference in future account value after 20 years of saving and investing is $343,000.

If you are an institution, add a zero or two to the end of each number for a better comparison on the effects to your business, organization, non-profit, endowment, foundation, or other.

fees.jpg

Is the “advisor” adding $343k worth of value? That amount would more than cover health care costs for a married couple throughout their retirement years, according to recent studies(3).

 To be clear, advisors can add significant value to a client relationship. Vanguard produced a research piece called the Advisors Alpha®(4) that makes the case that an advisor can add significant value beyond the fee they charge. However, it comes through a combination of wise stewardship and planning, portfolio construction and tax efficiency. In short, it is much work that deserves fair compensation. The challenge with the scenario outlined above is that any advisor would have difficulty justifying their value at that fee level when their only service is setting up an allocation and checking in once a year.

How You Can Avoid This

Having open and honest communication with your advisor is essential. Here are a few questions to ask that can help you determine if your advisor is acting in your best interest and has a compelling service and fee offering:

Fees & Services: What services will I receive and how much will it cost?

  • Service and fee schedules should be clearly outlined so you can determine what you are receiving and how much you are paying. You will be able to measure the potential "Advisors Alpha®." A contract should explicitly outline fees and the commitments being offered such as discretionary investment management, planning services, meetings per year, insurance reviews, risk management, estate planning, reporting and more. If you are an institution this will look slightly different, but it will still be the same idea. If your advisor cannot tell you exactly how they are going to serve you and what their charges will be, it might be best to keep looking.

Investment Fees: What is the fee for the underlying investments held in my account?

  • This question will help you asses the total fee that you will be paying and not just the advisors fee. Typically these investment costs can be minimal for accounts that use individual stocks, bonds, Exchange Traded Funds (ETFs) and index funds. However, for accounts that use actively managed mutual funds, insurance products or Separately Managed Accounts (SMAs), these fees can add up and take a toll on your long-term return.

Are you a Fiduciary: Are you a legal, written Fiduciary in all matters?

  • If your advisor is not a legal, written Fiduciary in all matters, beware that they have the flexibility to not apply Fiduciary standards in serving you. If they are a Registered Representative, Investment Representative, Broker or Insurance related, there’s a good chance they do not have to act in your best interest.

Are you an Expert: Do you have credentials or an advanced degree in your field of practice?

  • Your advisor should continue to learn and grow throughout their career. Legally, all advisors and brokers must have individual licenses such as the Series 6, Series 65, Series 7, etcetera. This does not make an advisor an expert. It is merely the cost of admission and is the SEC and FINRA's attempt to ensure there is some form of standard in the industry. Look for credentials such as CFA, CFP, CPA, or CIMA and for advanced degrees such as Master’s in Financial Planning or Master of Science in Finance. In short, credentials and advanced degrees help demonstrate the continued efforts of an advisor to learn and stay on top of trends in an incredibly complex and dynamic profession.

If you have questions about this article or any personal or institutional financial needs, we would love to help. Please do not hesitate to reach out to our team.

(1) According to the Chicago Booth Center for Research in Security Prices, from 1/1/1926 to 12/31/2017 the compound annual returns for US stocks were 10.0% and for international stocks, 8.0%. In this article, I have assumed an arbitrary and straightforward 9% average return solely for illustration. This does not constitute investment advice and should not be relied on as such. http://www.crsp.com/resources/investments-illustrated-charts

(2) https://www.forbes.com/sites/forbesfinancecouncil/2018/08/17/why-conflicting-retirement-advice-is-crushing-american-households/#4ddfd4f71355 

(3) https://www.fidelity.com/viewpoints/personal-finance/plan-for-rising-health-care-costs

(4) https://advisors.vanguard.com/VGApp/iip/site/advisor/researchcommentary/article/IWE_ResVgdAdvisorsAlpha


Related Articles

What You Need to Know About Sequence Risk
 

Image credit: Amol Tyagi

Over the last nine months since my daughter was born, I have learned to hear and translate her grunts, squeals, cries, and even noises that sound very similar to what a pterodactyl probably sounded like. The other night I woke to a cry that was not familiar. In her sleep she had stuck her foot through the slats in the side of the crib, but when she turned to pull her foot out, she could not; her foot was stuck. Putting her foot in the space between slats was easy, pulling it out…well, that was a different story.

This experience can be similar to that of an investor who has saved well for retirement but may have difficulties withdrawing dollars due to Sequence Risk. Sequence Risk, also known as sequence of return risk, is the risk assumed by an investor taking withdrawals from an investment account when receiving lower or negative investment returns. Specifically, this becomes serious early on in someone’s withdrawal timeline, as the investor/retiree ends up withdrawing a larger portion of their total portfolio than planned. Knowing what Sequence Risk is and how to plan for it is instrumental to a successful long-term financial plan. To illustrate Sequence Risk and its impact, let’s first look at the 20-year experience of two investors who are not taking withdrawals (Scenario 1) compared to the experience of the same two investors who are withdrawing from their accounts during that same 20-year period (Scenario 2).

A Scenario of Two Markets

Investor A deposits a lump sum of $400,000 in the S&P 500 (500 biggest companies in the US) on January 1, 1998. Investor A does not touch her investments for 20 years and now her balance is over $1,600,000, despite both the Dotcom Crash and the 2008 Financial Crisis. A great reward for the disciplined long-term investor.

With Investor B we see a similar scenario. She deposits a lump sum of $400,000 in the S&P 500 and doesn’t touch it for 20 years. Except this time the annual returns of the S&P 500, while staying the same, are randomized in their order and weighted for an early market downturn of two consecutive years of negative returns (-37% and -22.1%). After 20 years Investor B arrives at the same balance of over $1,600,000.

Scenario 1:

chart1.jpg

For the long-term investor, the sequence of returns does not seem to influence the investor’s portfolio if he or she is not withdrawing from their investments. Both Investor A and Investor B, while having very different market experiences, arrive at the same place. A great case for the long-term investor to not balk at market volatility.

The Sequence Risk for a Retiree

Where the order of returns does impact the investor (i.e., a retiree) is when they begin withdrawing from their investments in a down market. To see the impact Sequence Risk has on an investor, we will look at the same investment returns experienced by Investor A and Investor B. In this scenario the difference is each investor will begin taking annual withdrawals of $20,000 (5% of beginning balance) at the end of each year.

With Investor A, we see after the market experience of the S&P 500 from 1998 to 2017, she would expect to have $618k after 20 years of retirement.

As for Investor B, when the market experience begins with a downturn for the investor, the retiree’s balance would be significantly less, only $193k. A difference in the order of returns can mean a difference of almost $425k, or a 1/3 of the portfolio size, after 20 years.

Scenario 2:

chart2.jpg

Why does it matter?

Two retirees with identical wealth can have entirely different financial outcomes, depending on the state of the market when they start retirement and begin taking withdrawals, even if the long-term market averages are the same.

What do you need to do?

While you cannot control what the sequence of future returns is, there are things you can do to impact the success of your financial plan. If you are a long-term investor, make sure you have a plan, revisit the plan annually, and stay disciplined. If you are already in or are entering retirement, it is important for you and your advisor to plan accordingly:

Assess your risk. Appropriately assess your risk as you are entering retirement years. Assuming more risk than necessary paired with a down market can make you greatly susceptible to Sequence Risk.

Lower retirement expenses. Pay off any debt (including mortgage payments) before entering into retirement. Having fewer expenses in retirement provides flexibility for when the markets get rocky and withdrawing less is prudent (based on what was just laid out about Sequence Risk).

Have a short-term strategy be a part of your long-term financial plan. Hold assets that allow for flexible spending without having to veer from your long-term strategy. Holding cash or fixed income investments can provide short-term income sources, helping you avoid withdrawing a large portion of your total portfolio in a down market.

Continue working. If entering into a market experiencing low or negative returns, keep your job. What no retiree wants to hear after a long career of hard work! However, continuing to save and to delay retirement withdrawals by even a few years has the potential to yield long-term exponential growth.

While my daughter had no issue putting her foot in the space between slats, the issue was pulling her foot out. Dad was able to save the day. Realizing the most efficient angle, I was able to help her pull her foot out. With investors, sometimes it takes someone to come alongside and help strategize the most efficient strategy to withdraw dollars, no matter what is going on in the market. If you are planning on retiring soon and want help building a tailored financial plan and assessing the risk on your retirement accounts, let us know. Human Investing is here to help.   

*Scenarios are used for illustration purposes only. Past performance is not an indicator of future outcomes.


Related Articles

Why Dollar-Cost Averaging is a Great Investment Strategy
 

A recent theme in our client conversations has been around the timing of investing. On a regular basis we hear the question, “when is the right time to invest?” especially when times are uncertain. It’s a great question, one that is worth considering, but before answering this question let me state: We at Human Investing are long-term investors. Don’t mistake that for “buy and hold,” but rather “buy and assess.” Additionally, we believe financial planning is the key to investment success. While planning does not guarantee success, it does improve the odds of a successful outcome. In our advisory practice, the financial plan informs the investment decision.

Once the plan is in place and we’ve made the decision to invest, the timing of investing may not always mean we push a button to invest one hundred percent of someone’s capital in that moment. What it does mean is that we have a thoughtful discussion on the different strategies we might utilize to put the money to work, choosing the right option based on the client’s plan and their input.

Let’s walk through an example. The chart below is a hypothetical client who invests $500 per month ($6k/year) over an eleven year period starting January 2007 and ending December 2017. For this exercise we simulated investing the $500/month into a simple total stock market index exchange-traded fund with the symbol ITOT. The total invested capital in 2007 was $66,000 with net proceeds of $136,809 on the last day of 2017. Pretty incredible results considering the eleven year time frame included small gain and loss years of 2007, 2011, and 2015 and a large loss of 39.42% in 2008.

Picture1.png

This is a great example of a strategy called dollar-cost averaging. Dollar-cost averaging is an investment strategy with the goal of reducing the impact of volatility on large purchases by adding small amounts of the intended purchase into the market over a specified period of time. Technically speaking, taking a lump sum and immediately investing the funds for an extended period of time is the best option. The challenge with the lump sum method is that many investors struggle to invest 100% of their money right away due to factors like willpower and emotion. With the dollar-cost averaging approach the investor puts his money to work bit-by-bit, which for many, feels good emotionally and prevents money ear-marked for investing from staying in cash too long. For these reasons and others, the methodical dollar-cost averaging approach has become the most successful way to invest capital for the long-run.

My intent is not to vilify a cash investment as bad. For many investors cash has a place and a purpose within their overall portfolio. I’m looking to highlight an effective approach/strategy for when a client’s financial plan requires a greater return than 1%.  

If you’ve asked the question, “What is this money for?” and the timeline is long-term, consider the total sum you are looking to invest, divide that sum into a reasonable time period and make a commitment to dollar-cost average those funds into the market. In doing so you won’t find that you’ve kept the funds in cash for any longer than is necessary, and you will be well on your way to your stated long-term savings and investment goal.


Related Articles

Question. Discipline. Patience.
 

Investor Principles for Success

Investors big and small, sophisticated and simple, struggle to get the investment returns they desire. DALBAR and Associates and others have documented the performance shortfall for years, but few tangible solutions exist to close the gap between actual returns and expected returns. From what I’ve observed, I believe the core of investors and their advisor’s failure is in not asking the question, “What is the investment for? What is the savings goal?” prior to making investment decisions.

* DALBAR; Blackrock

* DALBAR; Blackrock

By consequence investors have failed to keep up with the performance of even the most passive investment. As mentioned, the success or failure of the individual investor is well documented by DALBAR and Associates. In the ten years leading up to 2016, investor returns (for asset allocation funds) were 1.89% per year. This return is far less than what a bond index (e.g. Barclays Agg.) would have yielded at 4.51%. The moral of the story? Individual investor behavior is a major contributing factor to under-performance. 

ASK THE QUESTION

Both advisors and individual investors must ask the question, “What is this investment for?” In other words, what are you trying to accomplish by foregoing spending right now and instead saving those dollars? Answering this question will create a goal/objective for the savings and will lead to investments that optimally align with the stated goal.

Consider for example Jane, a 25 year old investor with two different saving goals: 1) save for a house; and 2) save for retirement. It is fine if Jane thinks, “I’d like to be aggressive because I’m an aggressive person,” but that posture aligns much better with the retirement account that has 35-45 years before it is needed than it does for the house savings account with a 3-5 year saving and investing timeline. Because aligning investments with both the goal and the timeline is crucial when investing, ask the question, “Why am I saving. What is this for?”

BE DISCIPLINED

After you’ve answered the question for yourself and made the corresponding investments to align with your stated goal and timeline, it’s all about discipline. If like Jane you have a three to five year savings goal, then the objective would be a stable portfolio. But what if, during that time, Jane thought to herself, “The stock market is doing so well and my friend has made so much money investing in XYZ stock, maybe I’ll try and make a little more too.” While that is a fine thought, in the context of the goal and timeline, to act on it would be undisciplined. If the goal is to buy a house and it’s a short-term goal, the action for Jane is to maintain a stable job, budget her income, and stay disciplined to her investment plan since these will be key drivers in her ability to save for and purchase a house...not the stock her friend bought.

A lack of investment discipline may also impact the long-term investor. What if Jane made some aggressive choices for her VERY long-term retirement account? One day, the same friend who bought XYZ stock tells Jane, “I sold my stock. It was getting crushed. The market is crashing.” Jane may very easily feel that she made the wrong decision by investing “aggressively” in her retirement account and in reaction, sell. Being disciplined is about sticking to a prudent investment strategy based on your needs and timeline. For Jane, discipline may look like HOLDING these more volatile higher-earning investments not based on the short-term return but rather her long-term goals.

If the stated saving goals were aligned with the right investments, then there would be minimal volatility in the short-term house savings account. Similarly, with a longer-term goal (retirement) in place, Jane would expect to see more volatility with higher long-term returns than with the more stable investments she made for the house.

BE PATIENT

Whether you are an advisor or an individual investor, if you’ve asked the right questions and you have an investment plan to accomplish your goals, then be patient and wait for that plan to play itself out. If you’ve done the work upfront, then your probability for success will be much higher than if you failed to ask the question and go through the process.

Looking at the poor performance of the individual investor leads me to conclude two things: 1) too many investors have not asked the right question upfront to make an investment plan to meet their specific goals; and 2) those who may have started out by asking the right question have failed to stay disciplined to their objectives.


In summary,

1.       Ask the questions: “What is the purpose of these funds? What is the point of saving instead of spending?”

2.       Be disciplined

3.       Be patient


Sources: *BlackRock; Bloomberg; Informa Investment Solutions; Dalbar. Past performance is no guarantee of future results. It is not possible to directly invest in an index. Oil is represented by the change in price of the NYMEX Light Sweet Crude Future contract. Contract size is 1,000 barrels with a contract price quoted in U.S. Dollars and Cents per barrel. Delivery dates take place every month of the year. Gold is represented by the change in the spot price of gold in USD per ounce. Homes are represented by the National Association of Realtors’ (NAR) Existing One Family Home Sales Median Price Index. Stocks are represented by the S&P 500 Index, an unmanaged index that consists of the common stocks of 500 large- capitalization companies, within various industrial sectors, most of which are listed on the New York Stock Exchange. Bonds are represented by the BBG Barclay U.S. Aggregate Bond Index, an unmanaged market-weighted index that consists of investment-grade corporate bonds (rated BBB or better), mortgages and U.S. Treasury and government agency issues with at least 1 year to maturity. International Stocks are represented by the MSCI EAFE Index, a broad-based measure of international stock performance. Inflation is represented by the Consumer Price Index. Average Investor is represented by Dalbar’s average asset allocation investor return, which utilizes the net of aggregate mutual fund sales, redemptions and exchanges each month as a measure of investor behavior. Returns are annualized (and total return where applicable) and represent the 20-year period ending 12/31/16 to match Dalbar’s most recent analysis.


Related Articles

Strategies for Employer Plan Participants that hold Employer Stock
 

Do you participate in an employer’s retirement plan in which you own your employer’s stock? Before selling shares or rolling your account over to an IRA, you should consider a special election that could save you significant tax dollars. For taxpayers with employer stock held inside a qualified employer plan, the IRS allows a special election to distribute those shares at their cost basis and recognize the appreciated gain at preferential capital gain tax rates (avoiding “ordinary” income tax rates). This strategy is known as “Net Unrealized Appreciation” and is outlined in IRS code section 402(e)(4). The net unrealized appreciation is referring to the excess fair market value (FMV) of your employer shares over their cost basis. The election creates an immediate income tax liability on the cost basis of the distributed shares, but allows for continued deferral and favorable tax rates on the embedded and future gain.

There are three requirements to qualifying for and executing an “NUA” election strategy. First, the stock must be distributed out of your employer plan “in kind.” Transferring stock “in kind” means you take distribution of the stock itself, not its liquidated cash value. Second, the NUA election must be made as part of a lump sum distribution in a single tax year. You can make the NUA election on all or a portion of your employer stock and make a tax-free rollover with the rest of your account. The rules only stipulate that the entire account must be distributed/rolled over in a single tax year. Lastly, the lump sum distribution must transpire from one of four situations: death, attaining age 59 ½, leaving the company, or disability.

Below is a chart that outlines the tax treatment of employer stock distributed in an NUA election (www.kitces.com)

Graph-1-for-Todd-Strategies-for-retirement-plans.png

For example, let’s say you were a Nike employee and inside your 401(k) you hold 150k of Nike stock. Those shares have been purchased inside your 401(k) over a 20-year career and have an average cost basis of 50k. You retired last month and are looking to roll over your 401(k) assets into an Individual Retirement Account (IRA). Before making the rollover, you decide to make the NUA election on all your Nike stock. The distribution of those shares at their cost basis is immediately taxable at your ordinary income tax rates (i.e. 33% * 50k = $16,500). Those assets are now outside a qualified plan and all embedded and future appreciation can be realized at capital gain rates. Let’s say you then held those Nike shares until they were worth 200k. That 150k gain (200k FMV – 50k basis) would be taxable at 15%, or $22,500. So, in total with an NUA election, you paid $39,000 in Federal income tax. In contrast, by not making the NUA election, and rolling the entire 401(k) into your IRA there is no immediate income tax bill on the rollover, but all embedded and future gains are taxed at ordinary income tax rates. So, using the $200,000 fair market value assumption, and a lower 25% Fed tax rate, your tax bill would be $50,000 when drawn out of the rollover IRA account. The NUA election would have saved $11,000 in Federal income taxes.

Because there is a tradeoff between recognizing income immediately on an “in kind” stock distribution (NUA election) and a full retirement plan rollover, the cost basis in those employer shares is a significant consideration. The lower the cost basis in the shares, the better. Studies have shown unless your cost basis is 50% or less of the stock’s FMV at the date of distribution it is hard to make a case for the NUA election, and a full rollover to an IRA likely makes the most sense (www. kitces.com).

That said, everyone’s situation is different and there are varying factors that may lead to one recommendation over another. Even your desire for charitable giving may weigh in on the decision. For example, let’s say you were to make the NUA election and receive 100 shares with a cost basis of $40 and a FMV of $100; this would create 40k of gross income in the year of distribution. But, if you were to donate 40 of those 100 shares to a charitable organization or donor advised fund, you could create an offsetting 40k charitable contribution deduction. This offsetting deduction could mute the immediate income tax impact and leave you with 60 shares (60k value) that can appreciate at preferential tax rates outside of a retirement account.

There are a multitude of taxpayer specific situations and profiles that may or may not support making the NUA election. So, if you hold employer stock in a qualifying retirement plan and are getting close to retirement, looking to rebalance the account, or sell out of any of those employer shares, please reach out to us and see if an NUA election strategy makes sense for you.

If you would like to talk with one of our advisors please call Jill Novak at 503-905-3100.


Related Articles

How to Optimize Your Stock Options
 

Two Things to Consider When Managing Your Employee Stock Options.

Stock options are an interesting benefit. Instead of giving you actual shares of company stock, your employer gives you the “option” to buy a certain number of shares at a particular price. While options can be a tremendous benefit, they are frequently mismanaged causing you to either take too much risk or to miss out on most of the benefit. If you’ve been given employee stock options there are a couple of things to know.

First, there are a different types of stock options: Non-qualified Stock Options (NQs), Restricted Stock Units (RSUs), Incentive Stock Options (ISOs), etc. Second, the value of your stock options may differ from owning actual shares of stock. Understanding how options pricing works is key to getting the most from this potential benefit.

For this post, I’m going to focus on non-qualified stock options. Non-qualified stock options have a few moving parts that can have a major impact on your ending value - or whether there is any value at all.  When an employer, such as Nike or Intel, gives non-qualified stock options, they come with a particular grant price.  The grant price is the price at which you have the “option” to buy your shares of stock. Having an understanding of the stock price vs. the grant price will help you maximize the value and minimize your risk of loss.

The grant price is the key difference between owning actual shares of stock and a stock-option. Unlike owning actual shares of stock, your options value is based on the difference between the grant price and the actual stock price, not the value of the stock price itself. Therefore, if the actual stock price is greater than the grant price, your options have monetary value. If the stock price is below the value of the grant price, then your options have no value.  For example, if you have 1000 shares of Nike options with a grant price of $65 and the actual stock price is $58, then that particular grant would be worth $0.

Here are two common mistakes I see employees make:

Mistake #1 – Selling Too Soon

Until the stock price exceeds your grant price by a significant amount, you will have only a partial benefit. For example, let’s assume the following:

  • You were granted 1000 shares

  • The share price is $60

  • Your grant price is $57

Since the stock price is $3 more than your grant price, your options would have a value of $3000 ($3 of value per share x 1000 shares). While $3000 is a nice amount of money, it would only equate to 50 shares of actual stock ($3000/$60=50 shares). If you sell at this point in time you would effectively lock in a value of 50 shares instead of the full 1000 that you were given. As the stock price increases, your effective number of shares increases as well.

To show how this works, let’s assume the stock price increases to $80/share. How do your 1000 options look now? The new stock price of $80 gives you a value of $23/share ($80 - $57 = $23). Your new options value is $23,000 ($23 x 1000 shares). At this price, you’d have the equivalent of 287.5 shares ($23,000/$80=287.5).

In addition, you will notice that while the stock price went up from $60 to $80 in our example (an increase of 33%), your option value increased from $3000 to $23,000 (an increase of 667%). This is a phenomenon that is unique to stock options and one that can provide a lot of upside benefit. However, as you’ll see below, it can also expose you to more risk than you might think.

Mistake #2 – Holding on too long

For those of you who’ve seen some nice growth in your options over the years, you are possibly taking a lot more risk than you need to.  As you saw in our previous example, option value can rise significantly greater than the price of the stock itself. The flip side is that if the stock price declines, your options will go down in a greater percentage than the stock itself. Again, this is caused by the fact that you were not given 1000 actual shares of stock, but the “option” to buy 1000 shares at a price of $57/share.

To further demonstrate this, let’s use the reverse of the example above. If the stock price goes from $80 down to $60, a person who owns actual shares of that stock would lose 25% of their account value. However, since you have a grant price of $57 your options would go from $23,000 down to $3000.  That’s a loss of 87%!

Summary

Without a strategy for managing your stock options, you could be leaving a tremendous amount of money on the table and/or exposing yourself to a lot of unnecessary risk.

There’s no guarantee how any stock will perform in any given time-period, but with a proper strategy you can maximize your option value and minimize your risk, helping you stay on track with your financial goals.

If you would like help putting a strategy together to make sure you’re maximizing your options, give us a call at 503-905-3100.


Related Articles

Investment Strategies At Different Points In Your Life
 

A blog that our advisors frequent is https://www.kitces.com. On the surface, the structure of the site may look a little unconventional, but after spending some time at the site you will realize that this guy really knows his stuff. One of his recent articles struck a chord with me. Kitces speaks to all the phases of investing and how each “moves the needle” when it comes to saving for retirement and creating an income to supplement a desired retirement. The article breaks down your working years into 4 distinct phases: Earn, Save, Grow, and Preserve. Before I get into the phases let’s have the chart below (showing someone saving $300/month at 8% earnings spanning from age 25 to age 65) guide us through the phases.

Graph-for-Andrews-blog-Aug-1-2017.png

Something that stood out to me in the article was how powerful savings is at the beginning of retirement and how impactful an appropriate allocation is towards the end of your working years.

Consider these two scenarios:

Regardless of whether you are 25, 35, or 45 if you are just starting to save what matters even more than the allocation is how much you are contributing. Imagine if you have an account balance of $1,000 and contribute another $1,000 over the course of the year. With a $1,000 contribution you’ve doubled your money (or grown your balance by 100%). In contrast, if you were to have an above average year of performance, say 10% rate of return, but did not contribute to your account balance you would have grown your account $100. While $100 is nothing to dismiss, we can hopefully agree that it's not going to impact your retirement in a drastic way. Later on in life as your balance grows that 10% return will have a much greater dollar impact, but during the early phases of saving your contributions do most of the heavy lifting when building your account.

As you continue to work and save the pendulum will slowly swing from contributions having the most impact on your account to account growth (or capital appreciation) impacting your account. The below chart (again from Kitces) gives a representation of the importance your allocation has as you progress in your career.

Graph-2-for-Andrews-blog-Aug-1-2017.png

As you can see there is truly a shift in what influences your account most over time. Let’s look at that same $1,000 contribution later in life. Assume you’ve been saving for 20 years and your retirement account has grown to $250,000. The same $1,000 contribution now has less than a 1% impact on your account with the 10% rate of return on your account doing the heavy work to increase your account value by $25,000 (keep in mind a negative 10% return has the same impact on the opposite end of the spectrum).

So where do you go from here? Your savings rate and your allocation are going to impact your account value throughout the course of your working years with each providing great impact at different times during the course of your savings life. In fact, on average after saving in an account for 20 years, market growth accounts for 75% of increases in your account! A great rule of thumb is if you can pinch pennies in your 20s and 30s to build a great base in your account while keeping a growth allocation throughout your working years, you’re on your way to a successful retirement plan.

Call 5039053100

Email 401k@humaninvesting.com Sources

https://www.kitces.com


Related Articles

Identifying your investment risk
 

Our solution to identifying your investment risk… and why it matters

This past weekend my wife and I went and visited two of our best friends in the hospital who just had a baby girl. When we got the text that the baby had arrived, we were in line at the Nike employee store. As we got up the counter, my wife became teary eyed with thoughts of happiness for our friends, as you can imagine the check in person didn’t quite know what to do! The cool thing about being at Nike at that time, was that we were able to pick up this little number as a gift for the newborn, which I would highly recommend simply because it's awesome.

Later that night we went to visit them, and I had not been to a doctor’s office/hospital in a while, and while I was there noticed the “pain tolerance scale” up on the wall in our friend’s room.

This scale has always made me laugh as often times it is usually relative and doesn’t define what the parameters are. What signifies a 10 on the pain scale? A broken leg? Something more painful? I know for me it was crashing my bike and meeting the gravel face first.

This got me thinking about a financial scale that many of us have seen before called the “risk scale”. Most people who have invested before have probably been asked the question, “Are you more of a conservative, moderate, or aggressive investor?” And most people say some form of, “Moderate, I think? I obviously want to make money but don’t want to lose it all”. Similar to the pain tolerance scale, the question needs to be asked; what does conservative, moderate, or aggressive mean? This is a reasonable question many people have a hard time answering. Human Investing has recently partnered with Riskalyze, a company that looks to provide tangible risk information that investors can act on.

risk 2

risk 2

Here is how it works: After completing a simple risk questionnaire you are given a risk score from 1 to 100. This score acts as a benchmark (investor lingo for pain scale) and explains what to expect during different market conditions. For example, if you are invested in the S&P 500 your risk score is a 78 according to the assessment. It also shows you that generally in a given 6 month period of time you can expect a best case return of 28% and a worst case return of -18% with a historical average rate or return of around 9%. As the investor, YOU get to decide if you’re comfortable with that and can look at different investment options or portfolios that fit your goals and timeline best.

So why does this matter? Because over time investors typically under-perform the market due to things like lack of discipline, changing strategies, and trying to time the markets. We believe that a more informed investor who understands their risk and the upside and downside of their allocation can fair better. When I show this tool to 401k participants I often use the following sound bite to explain that most investors are emotional and have a short-term view; In 2014 the 20 year backward looking S&P 500 annualized return was 9.85% while the average US equity mutual fund investor annualized return was only 5.19%! Yes you read that right. Over a 4% difference per year the average investor missed out on.

Our hope is by equipping investors with information like this people can have a better understanding of which investment mix is best for them and how to stick to it over time. Thus, creating higher returns by increasing discipline.

If you are looking for an explanation about the pain scale, I am just as confused as you and probably can’t help. But, if you would like to have a conversation about your risk score and how to implement it, don’t hesitate to email someone from our team or give us a call!


Related Articles

Market Perspective
 

When, for a variety of reasons, the stock market experiences downside pressure, I often spend a lot less time on the headlines and more time on the history. Because every market presents itself differently with no up or down move in the market looking exactly like another, I am compelled to look at what the market has shown us through data that goes back to 1825. After tearing up several drafts over the past few days, I pray I’ve struck the right tone in what you are now reading.  There are several key points I’d like to share after a long weekend of research.

Market Fluctuations Stock market fluctuations are an inevitable part of investing.  Declines in the market never feel good but are quite normal to experience.  History has shown us that declines have varied widely in intensity, length and frequency.

A History of Declines from (1900-December 2014) Dow Jones Industrial Average

Type of Decline        Ave. Frequency                          Ave. Length                 

-5% or more 3 times per year 46 days -10% or more 1 time per year 115 days -15% or more 1 time every two years 216 days -20% or more Approx. once every 3 1/2 yrs. 338 days


As a different point of reference, when observing the market between the years 1825-2013, I see the following:

  • The market had 134 positive years and 55 negative years (the market was positive 71% of the time)

  • 44% of the time, the market finished the year between 0% and +20%

  • 60% of the time the market finished the year between -10% and +20%

  • Only 14% of the time did the market finish worse than -10%

  • Less than 5% of the time did the market finish worse than -20%

  • The market was 5 times more likely to be up 20% or more in a year (50 out of 189) than down 20% or more (just 9 out of 189)!

Lessons learned from past markets:

  1. No one can consistently predict when market declines will happen.

  2. No one can predict how long a decline will last.

  3. No one can consistently predict the right time to get in or out of the market.

  4. The historical odds of making a gain in the market is good.

  5. The historical probability of losing money in the market on any given calendar year is low.

Investing and Emotions In economics and decision theory, loss aversion refers to people's tendency to strongly prefer avoiding losses to acquiring gains. Most studies suggest that losses are psychologically twice as powerful as gains.  I’ve studied loss aversion in the classroom, taught on loss aversion in an academic setting and lived through how this plays out for investors during market declines.  In short, emotions have the potential to destroy an investor’s ability to achieve their financial goals.

In an annual Dalbar study, the research firm stacks up investor returns vs. those of stocks and bonds.  The study, published in early 2015, looked at returns from 1995-2014 which showed the stock market averaging 10% per year for the previous 20 years where the average investor returned around 2.5% - just a hair over inflation.  Much of this underperformance can be attributed to overly confident investors purchasing when the market is reaching new highs and panic-stricken investors selling when the market declines.

Lessons learned from emotions and investing:

  1. Have a well thought out financial roadmap.

  2. Review the roadmap during both good and bad market cycles.

  3. Ask yourself, “Other than my emotions and the market, has anything changed with my financial plan and goals?” If not, stick to the plan. If things have changed, let’s talk.

  4. Historically, selling investment to relieve anxiety about the markets can be costly.

Summary We know the markets will surprise us.  The consensus estimates of “where the market will go and why” are most often wrong.  History will not repeat itself in the market the same way, but we can learn a lot from both historical data and behavior.

When the market is volatile, particularly when it’s in decline, it can be unnerving for many investors. The concept of “buy and hold” never sat well with me. I prefer “invest and assess.” Whether in stocks or bonds, investing has to be with a purpose and a plan - period.  Our team’s work is to serve you by synthesizing your information into a plan with a purpose. Having the plan in place, we practice “invest and assess” with the goal of offering you confidence in how your plan will play out both in and through retirement.


Related Articles

How to Stay Positive When the Market Gets Negative
 

When investors experience market turbulence, it’s never fun. It’s a lot like being on a plane when the fasten seatbelt sign goes on and the wings of the craft start flapping like a bird in air. Our investment firm has experienced 30% of the worst days in the market since the year 1899, so we’ve endured our share of turbulence. The purpose of this note is to address participants investing in their 401k plan and to share lessons we’ve learned from the past.

  1. Participants should understand what is “normal" turbulence in the stock market. A correction (aka turbulence) is typically defined by a decline of 10% or more with a “bear market” declining 20% or more. Although corrections and bear markets never feel good, they should be considered normal and expected. In the last 85 years, there have been 51 corrections or bear markets. In the last five years alone, we’ve had six periods of declines of nearly 8% or more. In short, normal never feels good but normal is normal.

  2. As the Dow Jones has increased in value from the year 1987 (1,793) to today (16,000), the drops in point value don’t have the same impact as in earlier times. Take for example the one day crash in 1987 where the market lost 8% of it’s value in a single day with a 156 point drop. If that same sort of drop were to occur today, we’d need to see a 1,600 point plunge. The bigger number seems scarier on the surface but its impact as a % loss on the portfolio is the same. Put another way, 156 point drop today would not even be a 1% drop…

  3. When thinking about what to do when turbulence sets in, participants MUST think about their personal timelines for their money. In most cases, for someone 50 years or younger, you’ll have 15+ working/investing years before retirement. During those 15 years you get the benefit of being able to buy into the market as it declines. Ultimately, without having to think about it, you are buying lower with the hope that the shares you are purchasing NOW will be worth more in the future. For those nearing retirement, the question about what to do is a bit more complex. At or near retirement making sure you have adequate cash and safe investments to cover living expenses is everything. Having several years worth of living expenses put aside in CD’s, cash, or money markets makes a ton of sense. This enables you to hold onto the stock or equity investments you have until the turbulence subsides.

  4. Managing your emotions during the turbulence is wise. Much like unbuckling your seatbelt and walking around the cabin during a rough flight, making snap decisions about your 401k during turbulent times can be dangerous to your financial future. Again, although it does NOT feel good when the market(s) get choppy, acting prudently and slowing down can greatly benefit you and your retirement funds. One of the many benefits of being a Human Investing 401k client is access to our 8am-5pm Monday to Friday call in line. One of our advisors can walk you through all your options as well as give you advice based on your specific account. In the end, whatever you opt to do, your decision will be well thought out, informed and discussed.

There are many important lessons we’ve learned from the past. This note is intended to take those lessons and to provide you with some perspective and thoughts on how you might want to approach volatility in your account. In the end, if you have questions and want to talk it over with one of our advisors, please call us as we would be happy to hear from you.


Related Articles