High-income Portland/Metro area residents, have you paid your 2021 local taxes yet?


Did you Make Over $125,000 Individually or over $200,000 as a Married Couple?

There are two new local personal income taxes that became effective for the 2021 tax year. These two taxes, explained below, are specifically for single filers with Oregon taxable income above $125,000 and married jointly filers with Oregon taxable income above $200,000.

These two programs are local taxes, not state taxes. This means that the tax payments go directly to The City of Portland and require an additional filing. We expect high-income earners in the Portland-metro area to have at least three tax returns for 2021: US Individual Income Tax Return, Oregon Income Tax Return and City of Portland.

Like your federal and Oregon state tax return, these local tax returns are also due by Monday, April 18.

Local tax #1: Preschool for All (PFA) Personal Income Tax

In November 2020 Multnomah County voters passed The Preschool For All Program which will provide tuition-free preschool for children that meet the program criteria.

  • This local tax is funded by a 1.5% marginal personal income tax on taxable income above $125,000 for single filers and $200,000 for those married filing jointly.

  • This local tax is also funded by an additional 1.5% tax is imposed on taxable income over $250,000 for single filers and $400,000 for those married filing jointly

Local tax #2: Portland Metro Tax

In May 2020, Portland-area voters approved Measure 26-210 which will provide homelessness services like shelter, advocacy, and mental health resources.

  • This local tax is funded by a 1% marginal personal income tax on taxable income above $125,000 for individuals and $200,000 for those married filing jointly.

  • This local tax is also funded by a 1% business income tax on net income for businesses with gross receipts above $5 million.

  • The Portland Metro area includes residents of Multnomah County, Clackamas County, and Washington County. For a full reference guide of the Metro jurisdiction use this online tool.

How can I Find my 2021 Taxable Income?

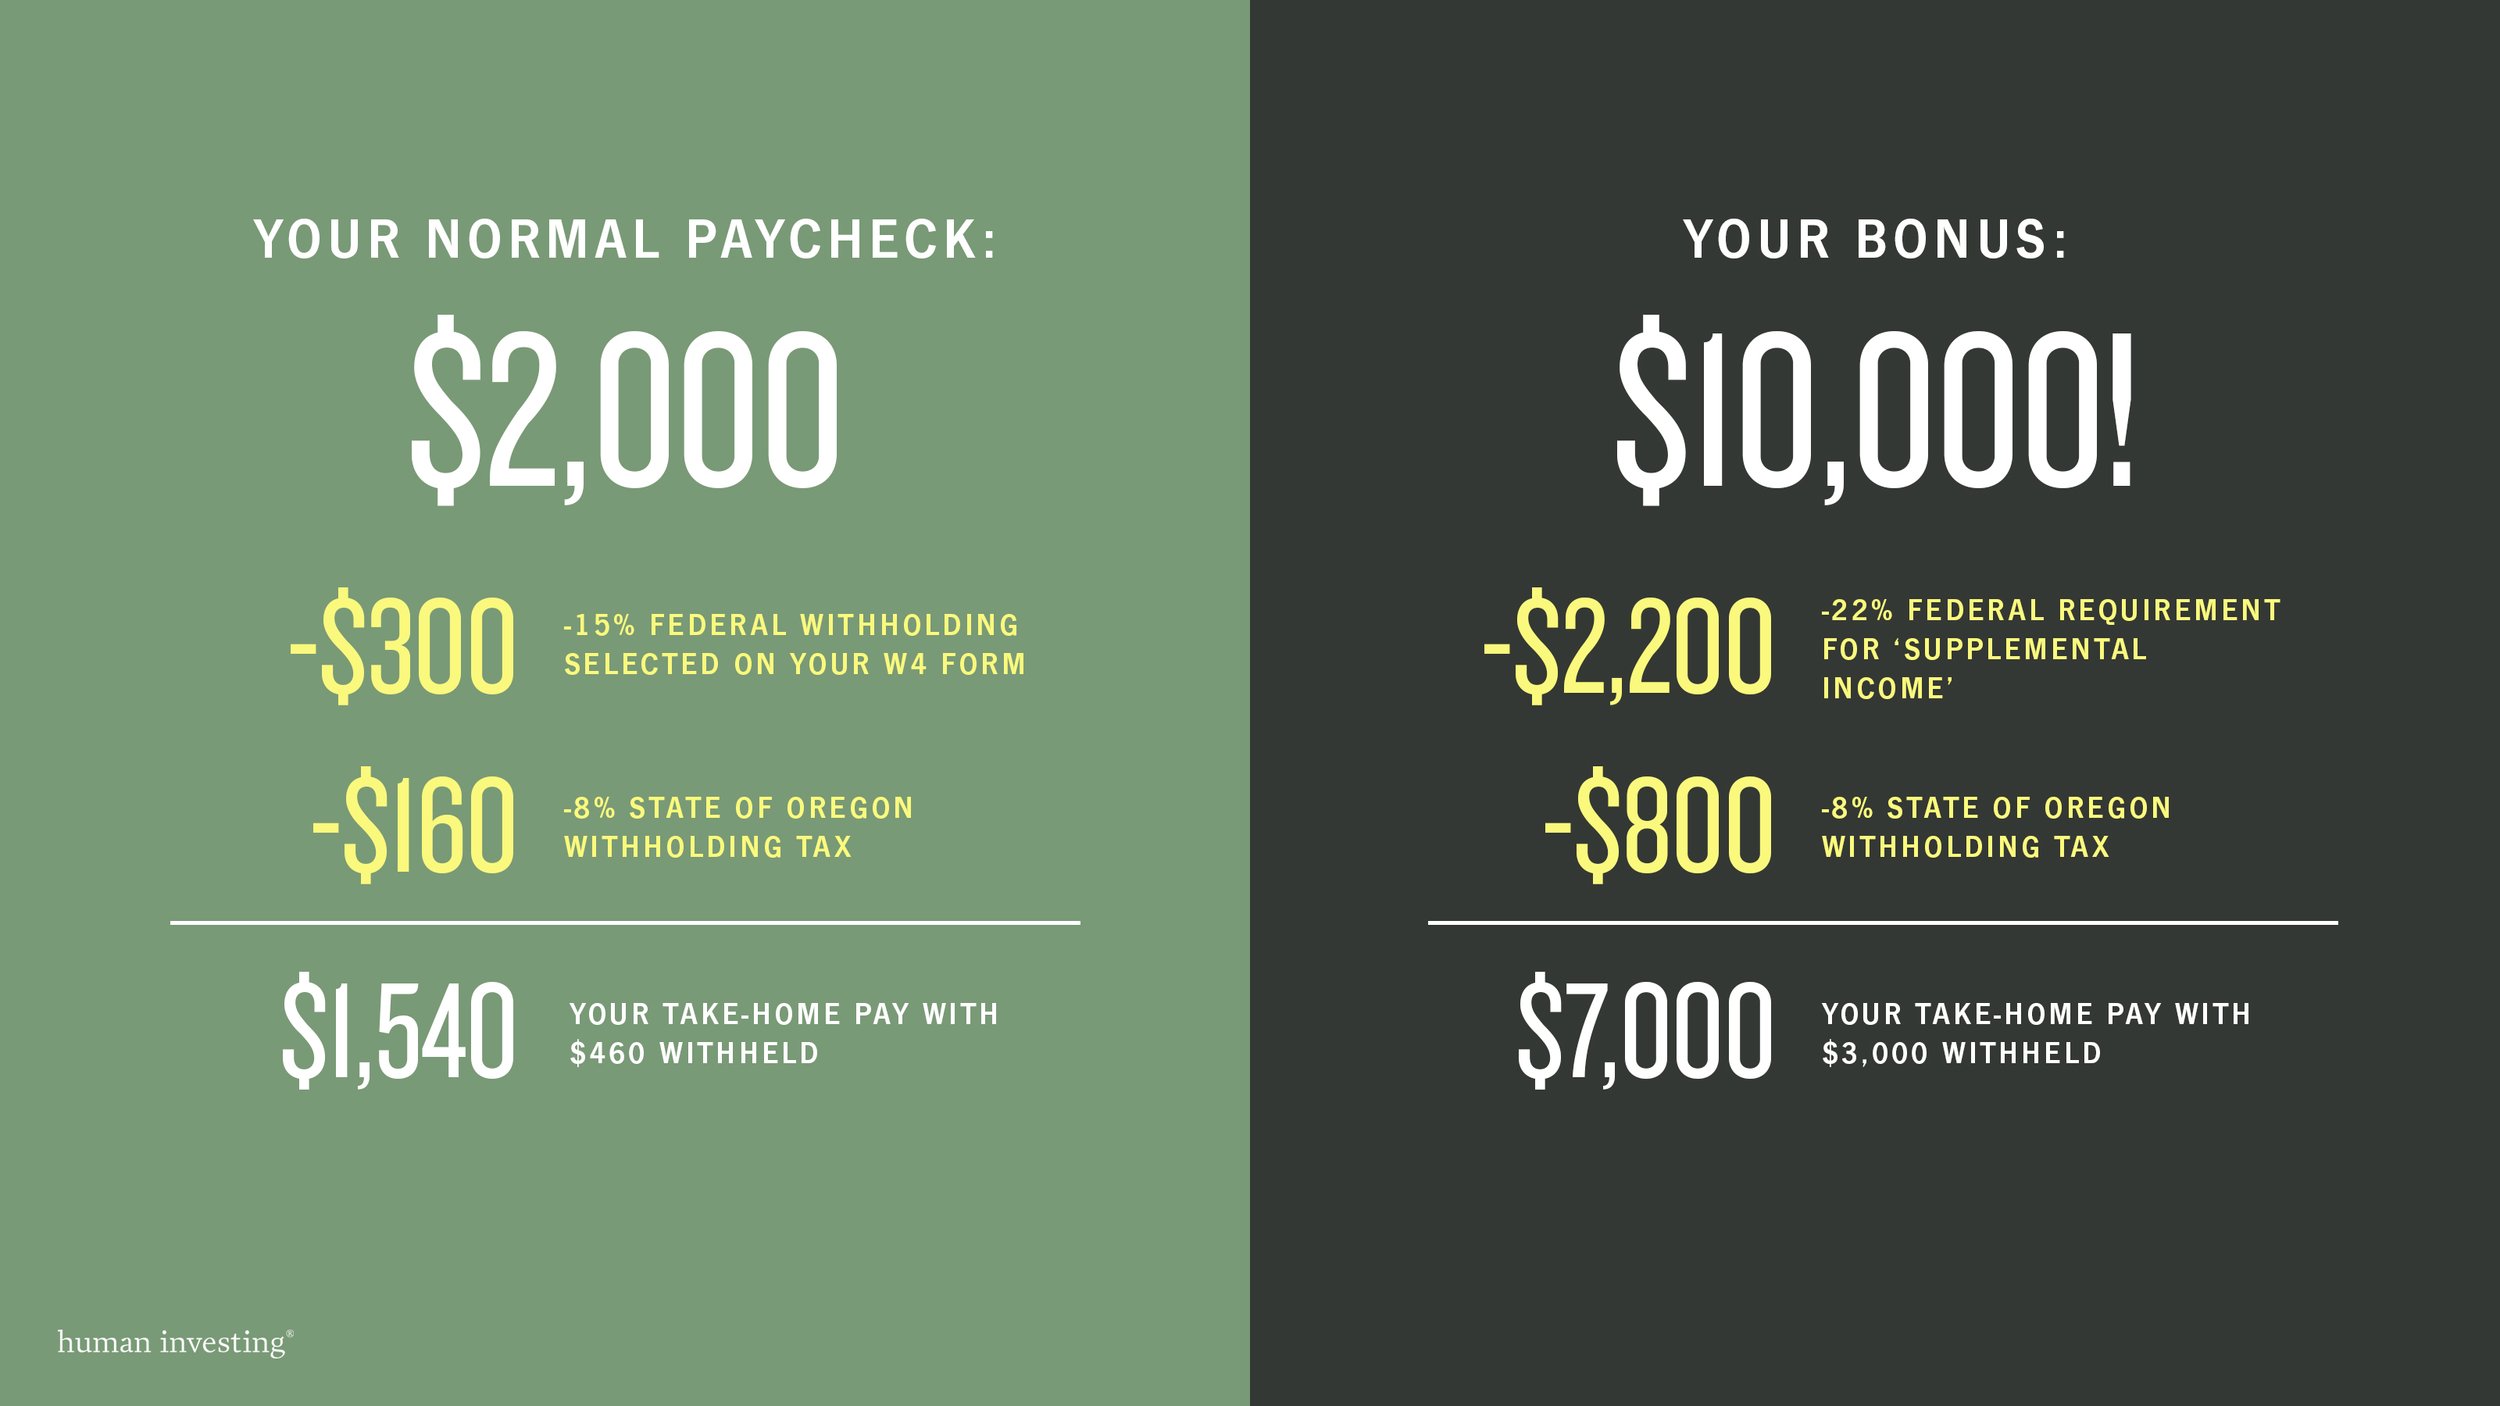
Taxes are complicated. Remember that your income (like your salary) is not the same as your taxable income. For example, you could earn a salary of $140,000 a year but have less than $140,000 of taxable income because of pre-tax retirement account contributions and taking the standard deduction or itemized deductions.

The easiest way to confirm your 2021 Oregon taxable income is to complete an Oregon Income Tax Return. Your taxable income is included on line 19 of your Form Oregon 1040.

If you are a single filer and your Oregon taxable income (on Line 19 on your 2021 Form OR-40) is greater than $125,000 or if you are a married jointly filer and your Oregon taxable income is greater than $200,000 then you likely need to pay your taxes by April 18, 2021.


FINDING YOUR TAXABLE INCOME IN TURBOTAX

1. Login and find the Documents tab.

2. Download your tax PDF. Scroll to the bottom of the PDF for the Oregon return.  

3. Find your 2021 Form OR-40. Line 19 includes your total taxable income.


examples of Calculating your local taxes owed


Preschool For All Tax: $0 because her income is below the $125,000 threshold for individual taxpayers.

Portland Metro Tax: $0 because her income is below the $125,000 threshold for individual taxpayers.


Preschool For All Tax: $6,000.
Tier 1: $400,000 - $200,000 = $200,000 of taxable income. $200,000 x 1.5% = $3,000
Tier 2: Then, $500,000 - $400,000 = $100,000 of additional taxable income. $100,000 x 3% = $3,000

Portland Metro Tax: $3,000.
$500,000 - $200,000 = $300,000 of taxable income. $300,000 x 1% = $3,000


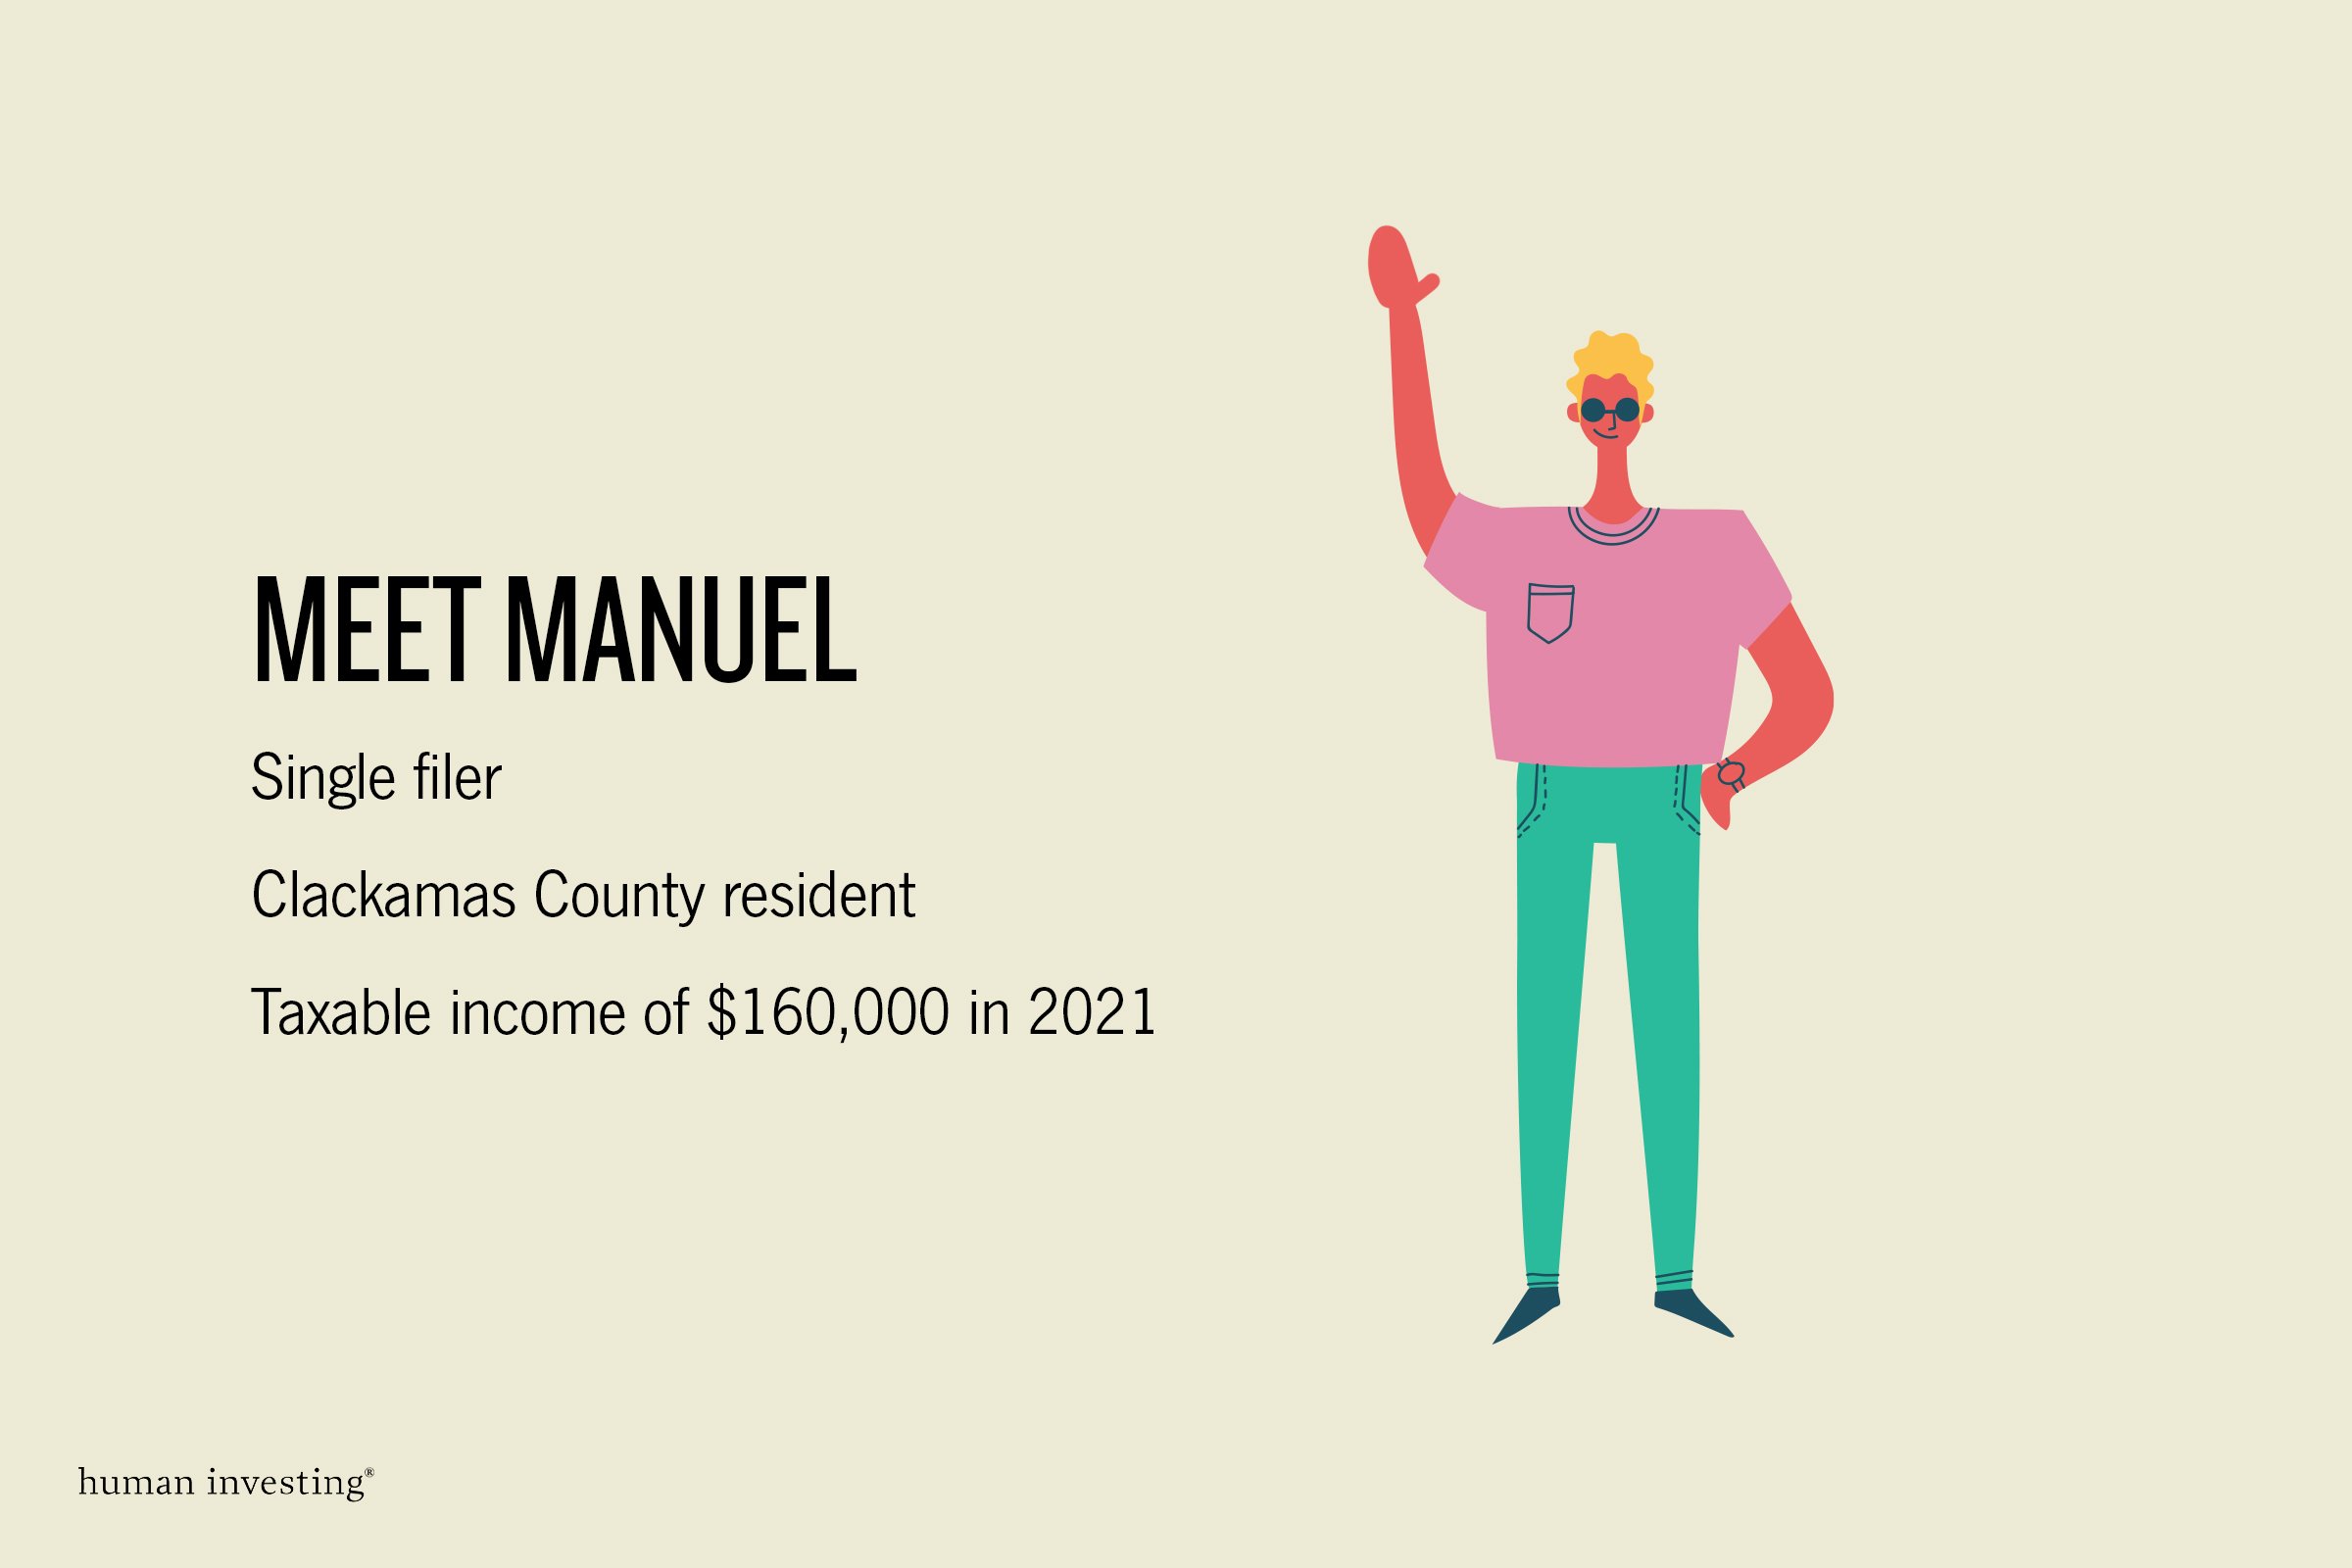
Preschool for All Tax: $0 because they are not a Multnomah County resident.

Portland Metro Tax: $350.
$160,000 - $125,000 = $35,000 of taxable income above the threshold. $35,000 x 1% = $350


How Can I Pay for this Tax?

If you hire a CPA to prepare your individual tax returns, we recommend confirming that they will also file your City of Portland taxes for you. 

If you use an online tax software like turbotax, you will have to visit the Pro.Portland.gov website to submit your tax payments in a separate return. If you are a Multnomah County resident, this process will feel similar to paying your $35 Arts Tax.

What if my Taxable Income is Below the Limits for the PFA and Metro Tax?

You do not need to file anything to the city of Portland if your taxable income is below the limits for both local taxes in 2021. However, if you are a Multnomah County resident then don’t forget to pay your Multnomah County Art Tax for 2021. You can pay for it here: Portland Arts Tax Online Payment.

If you have more questions about the new local taxes, or would like to speak to a financial professional please reach out to us at hi@humaninvesting.com or 503-905-3100.


Related Articles

War and the Market: What Does History Teach Us?
 

With Russia’s invasion of Ukraine this week, many are wondering how a conflict in Europe will influence their own finances. In addressing this headline for our firm, please understand that the loss of life and the disruption of peace weighs heavy on me and our team. While considering investor concerns, our goal is to provide a point of view which I feel we are uniquely positioned to share amid war as a financial management firm.

Markets trade on future expectations. For example, if the market expects new jobs or a strong economy, then people and businesses adjust their decisions today, based on what they believe is coming. Remember how the market crashed when COVID-19 first hit the United States, but bounced back a month later? That’s because people were making choices based on expectations, not necessarily reality.[1] Because war follows a circuitous route, forecasts are less clear. Researchers accurately note that “the impact of conflict on human lives, economic development, and the environment is devastating.”[2]

Previous Wars and Invasions Show That Market Reactions can Range Wildly.

For example, in 1990, Iraq invaded Kuwait and immediately the global stock markets declined.[3] In the three days that followed the Iraqi attack on Kuwait, the Dow Jones Index slid over 6%; yet in the first four weeks of Operation Desert Storm, the Dow gained 17%.[4] Additionally, the European Stock market responded positively to the second conflict with Iraq in early 2000. Stock market history has shown divergent reactions to war.


Surely, the economy of Ukraine will be devastated, but no one knows what the financial repercussions from this Eastern Europe conflict are. For example, when the news broke about Russia’s invasion, the European markets went down around 4%, but the US market went up by about 1.5% at the end of the day. We simply can’t predict the future, and the market changes moment-to-moment, day-to-day. The only real certainty is that volatility will resume as individuals and institutions place their bets on future predictions, and because of this, our client financial plans and asset mixes navigate all types of situations.

Finding your Footing in Uncertainty

Market related volatility is an un-welcomed but natural part of the investing journey, so our client portfolios at Human Investing are constructed with a plan and risk tolerance in mind. For example, a client that has cash needs to support their day-to-day expenses (such as a retiree) will often have a portfolio with equities that pay dividends, bonds that pay interest, and ample cash to cover upcoming obligations. On the other hand, investors who rely on equities should understand that stock volatility is the price we pay for the expected premium we receive in the long run over cash and bonds.

Although the headlines of “war” and “invasion” cause anxiety, the questions investors should ask are, “How is my plan working out?” and “Despite the market volatility, am I still on track?” Keep in mind that although the average annualized return of the S&P 500 since 1926 is approximately 10.5%, market swings may increase considerably. [5]  Investors should think about their financial plan, investment goals, timelines, and overall diversification to determine how well they are prepared to manage the ups and downs. Adjustments can always be made to ease the concern in the short term, but for most of our clients, their financial plan and current asset allocation take into account market downturns, caused by a myriad of events, including invasions and war.  Through it all, we at Human Investing are present in all of life’s ups and downs as we faithfully serve the financial pursuits of all people.


[1] Frazier, L. (2021, February 11). The coronavirus crash of 2020, and the investing lesson it taught us, Forbes. The Coronavirus Crash Of 2020, And The Investing Lesson It Taught Us

[2] Cranna, M. (1994). The true cost of conflict. New York: New Press. The true cost of conflict / | Colorado Christian University

[3] Richter, P. (1990, August 3). Markets react to Kuwait crisis: Stocks: Invasion rocks market; dow slides 34.66, Los Angeles Times. MARKETS REACT TO KUWAIT CRISIS : Stocks : Invasion Rocks Market; Dow Slides

[4] Schneider, G., & Troeger, V. E. (2006). War and the world economy: Stock market reactions to international conflicts. Journal of conflict resolution50(5), 623-645. War and the World Economy: Stock Market Reactions to International Conflicts

[5] Maverick, J. B. (2022, January 13). What is the average annual return for the S&P 500? Investopedia. S&P 500 Average Return: Overview, History, and Factors


Related Articles

Really? My Bonus is Taxed the Same as my Paycheck?
 

Your bonus is not taxed more than regular income.

Have you ever noticed the discrepancy between the bonus payment that was communicated to you and the actual bonus payout? As an example, let’s say your employer announced that you will get a $5,000 bonus, but the upcoming paycheck is only $3,500. What happened?! The common and incorrect narrative is something along the lines of “Bonuses are taxed more than regular income!”

This is not true. Bonuses are taxed at the same rate as your regular income. Please keep reading if you would like to see an example.

Why do we think that bonuses are taxed more than regular income?

Probably because bonus payments are treated by the IRS as ‘supplemental income’, whereas your regular income is treated as ‘ordinary income’ by the IRS.

Supplement and ordinary income are taxed at the same rate. However, supplemental income (like bonuses, overtime pay, severance, and tips) require employers to withhold more taxes. Due to the tax withholding, it feels like bonuses are taxed more than regular pay. And yes, they do have more taxes withheld up front so it does impact your cash-flow.

Because we love round numbers, let’s look at an example of for someone that normally receives a $2,000 paycheck and a one-time $10,000 bonus.

$10,000 bonus example

January 5, 2022: Your employer informs you that you will receive a $10,000 bonus.

January 10, 2022: You receive your paycheck that includes your typical income and the bonus payment.


Your regular income of $2,000 was subject to the following tax withholdings:

15% - federal withholding selected on your W4 Form

8% - state of Oregon withholding tax

23% - total withholding (federal + Oregon)

Your take-home pay is $1,540.


Your bonus paycheck was subject to the following tax withholdings:

22% - federal requirement for ‘supplemental income’

8% - state of Oregon withholding tax

30% - total withholding (federal + Oregon)

Your take-home bonus payment is $7,000. As you can see in this example, the total tax withholding for the bonus payment is greater than the tax withholdings for typical paychecks.


Your tax withholdings are not the same thing as your tax payments.

As shown in the example above, $3,000 was withheld from the bonus payment. This is an upfront payment to the IRS, but it doesn’t mean that this person will actually pay $3,000 in taxes for this bonus At the time of filing their tax return, they may receive some of that money back (a tax refund) or they could end up owing more taxes if they have significant income during the year.

As illustrated above, supplemental income has a 22% tax withholding rate. However, most taxpayers have a lower effective tax rate than that which means they will receive money back from the IRS once they have filed their taxes. We have included an example below to help clarify this concept.

The taxes paid on bonuses are the same as taxes paid on ordinary income.

While tax withholdings are different for regular income and bonus payments, the actual tax rate you pay is the same. Once you file your tax return the actual taxes paid are trued up.

Here is an example of a single tax-payer making a salary of $48,000 a year and a $10,000 bonus. They would see $58,000 appear in box 1 of their W2 Form issued by their employer. The total combined income of $58,000 is then subject to income tax brackets.

The key point is their entire income of $58,000 is subject to the same income tax brackets and end up with the same tax treatment. The difference is only the amount withheld when the bonus is paid out. We know that the $10,000 bonus had 22% in federal tax withholdings, but we can also infer that this person’s effective tax rate is probably lower based on the progressive tax brackets shown in this image.


To be clear, the first $10,275 gets taxed at 10%. The next $31,500 (range is dollars above $10,276 and below $41,775) get taxed at 12%. The remaining $16,225 is taxed at 22%. I encourage you to read the blog post titled 2022 Tax Updates and A Refresh On How Tax Brackets Work if you want a detailed explanation of our progressive tax brackets.

Whether or not this person will receive a tax refund or owes more taxes at the time of filing their tax return depends on the rest of their financial landscape. We can save that information for another blog post!

Whatever it is, the way you tell your story online can make all the difference.
— Quote Source


Related Articles

Are Series I Bonds right for you to hedge against inflation?
 

There has been a lot of news on high inflation coming and its looming effects on everything from investment portfolios to the price of milk.

As people are searching for ways to combat high inflation and preserve how far their money can go, we’ve been receiving many questions on an investment option called I Bonds. Questions about what they are and why they haven’t heard of them before.

Our hope is to shed some light on Series I Savings Bonds (I Bonds), available here, and outline how the investment works before offering our recommendations.

How risky is an I Bond?

I Bonds are US treasury bonds, meaning they are backed by the full faith and credit of the US government, making them one of the safest, lowest risk investments possible.

What is the interest rate on an I Bond?

There are two parts to the interest rate on an I Bond.

  • A nominal (fixed) rate — currently 0% as of November 2, 2021.

  • An inflation (floating or adjustable) rate that changes every 6 months — currently 3.56% as of November 1, 2021.

These two rates are added together to determine the interest rate on an I Bond, so the current rate on the I Bonds for 6 months is 0% (nominal) + 3.56% (inflation) = 3.56% total (which is 7.12% annually). This interest rate cannot drop below 0% even if there is ever a negative inflation adjustment. See here for historical I Bond interest rates.

The floating rate on I Bonds will adjust as inflation adjusts. Today, inflation rates are high, but as the historical rates table in the link above shows, inflation rates can be lower.

When can I access my money?

An important factor to consider is that I Bonds only pay interest upon maturity, so you will not receive cash flows from the I Bond as you hold it.

I bonds have no secondary market, so you cannot resell your I Bond, you can only redeem it. I Bonds have no liquidity for the first year after purchase, so it’s important that you will not need to access the funds for at least one year. For years 1-5 after purchase, you may redeem your I Bond early by forfeiting the last 3 months of interest. After 5 years, you may redeem the bond early without penalty. I Bonds will mature 30 years after purchase.

How do the taxes work?

I Bonds only pay interest upon maturity. You can claim (pay) the taxes on the earned interest every year on your I Bonds, or you can pay taxes on all interest upon maturity of the I Bond. I Bond interest is not subject to state or local taxes. See here for more information.

How do I purchase I Bonds?

You have to purchase I Bonds directly through treasurydirect.gov, or with your federal income tax refund. See here for more information.

You are limited to $10,000 of I Bonds through electronic purchase, and $5,000 of I Bonds through paper purchase via your tax refund, for a total limit of $15,000 of I Bonds in a calendar year.

The pros and cons of waiting to get paid out

If you’re still wondering if these bonds are right for you and your financial plan, weigh the pros and cons below against your goals.

Pros:

  • The inflation adjustment makes I Bonds a great inflation hedge

Cons:

  • Interest is only paid out upon maturity, so don’t utilize I Bonds as a source of cash flows over time

  • Funds are locked up for 1 year, so don’t use I Bonds for any funds you might need before then

Other considerations:

  • I Bonds must be purchased on your own, so they’re for a more DIY inclined investor

  • The inflation adjustment rate will change adjust over time, so the precise amount of interest an I Bond will earn is uncertain

  • Consider the potential taxes of having all interest hitting upon maturity of the I Bond, or having to pay taxes each year on interest you have not yet received

  • You are limited on how much you can purchase in a year

I Bonds are typically best for medium term (i.e. around 5 year) savings goals.

The inflation adjustment reduces your risk of losing purchasing power due to inflation. The low nominal rates on I Bonds today means your funds will not grow faster than inflation.

For longer term savings goals (i.e. retirement in 10+ years), equities are a great long-term inflation hedge, because companies can adjust their prices (and therefore dividends & earnings) based on inflation. Treasury Inflation Protected Securities (TIPS) are another, lower risk than equities, investment that adjust for inflation.

If you have more questions about I Bonds, or would like to speak to a financial professional about other investments, please reach out to us at hi@humaninvesting.com or 503-905-3100.


Related Articles

Charts of Q4 2021
 

Season’s Greetings! We have assembled this post during the final days of 2021. We hope you have enjoyed some rest these past few days and you are heading into 2022 feeling optimistic.

As promised, we are sharing some of our favorite charts from Q4. Specifically, we included charts that include information about the increase in Social Security benefits, the S&P500’s 69 all-time highs in 2021, mentioning the S&P500 powerhouses, and reviewing some annual price changes.

1: Social Security and Supplemental Security Income (SSI) benefits will increase 5.9% in 2022.

In October, it was announced that Social Security benefits will increase by 5.9% starting in January 2022. As this chart indicates, the 5.9% increase starting in 2022 is the largest uptick since the 1980’s. This is good news for most people since social security checks will be bigger.

The increase in benefits impacts households who are already taking social security and those who will be taking their benefits soon. If you haven’t already received the COLA notice in the mail, you can access your updated Social Security statements here: my Social Security | SSA

2: The S&P500 reached 69 all-time highs in 2021.

Throughout this past year, the S&P500 hit a new all-time high 69 times. That’s remarkable! You should spend some time looking at this chart, but as a sneak peek, 1995 is the only year that incurred more all-time highs that 2021.

What does this mean for you? Looking back, it means that checking your account balances in 2021 was thrilling if you have exposure to the S&P500. To summarize the year’s performance, the index is up almost 30% since January 1, 2021.

During market years with this many records, the stock market attracts fair-weather fans. Going forward, we recommend that you define and/or revisit your investment goals and stick to your plan as best as possible.

3: The S&P500 powerhouses.

The S&P500 is a stock market index that measures the performance of about 500 companies in the US. If you have attended one of our group presentations, then you may recognize that we often say that “the S&P500 is synonymous with the US stock market”.

By the end of 2021, there were 6 companies that made up 26% of the market capitalization (# of shares x price of the shares) of the S&P500. These same 6 companies only made up 10% of the S&P500’s total revenue, or the money the companies pulls in from their sales.

This chart made an appearance in our final Charts of the Quarter post for 2021 as a reminder that these six organizations (Microsoft, Apple, Google, Amazon, Tesla, and Meta Platforms) have kept their spots in the starting line-up of the US stock market. We can also give kudos to these six companies for the S&P500’s returns in the recent past. Since 26% of the S&P500 has strong performance, the 2021 bad apples received less attention.

4: Picking trends is (still) hard.

We assembled a chart with two companies that we rely on everyday — Peloton and Zoom. Zoom has been crucial for engaging with our clients these past two years and many Human Investing employees converted to Peloton workouts mid-pandemic. Look at this chart! There is a disconnect between Zoom and Peloton’s abysmal performance in 2021 and our expectations as loyal customers.

Let this chart be a reminder that picking trends in the stock market has always been challenging and it will continue to be going forward. Investing in individual companies can lead to a make-or-break situation.

Source: @Sean_YCharts

5: Inflation took over headlines in Q4 2021.

Overall, the CPI (Consumer Price Index) rose 6.2% from October 2020 to October 2021. This is the fastest annual increase since 1990. While it is true that things got more expensive this past year, inflation is a delicate topic because every year some things get more expensive while other things become more affordable. For this reason, we try to avoid generalizations about inflation.

As the chart indicates, this past year we have experienced a concentrated increase in transportation costs like fuel oil, motor fuel, car and truck rentals, piped utility gas service, and used cars and trucks. Meanwhile, the average cost of an airline ticket has decreased compared to 2020.

We agree that inflation is uncomfortable. That is a true statement even though inflation is always moving and rarely a stable metric.


That is a wrap for the 2021 year. We wish you the very best 2022! — Your Human Investing Team


Related Articles

ChartsHuman Investing
Medicare Must Know's When Turning 65
 

Medicare is an important part of your retirement plan. We hope this overview is a helpful resource to know when to apply and how much it may cost.

Before you turn 65…

Most people turning age 65 should sign up for Medicare during their Initial Enrollment Period (IEP). During your IEP, which starts 3 months prior to the month you turn 65 and lasts until 3 months after, you can enroll in Medicare Part A (Hospital coverage), and Medicare Part B (Doctor visits). Medicare Part B pays 80% of most medically necessary healthcare services and the beneficiary pays the remaining 20%. You may also join a Medicare Part D plan (Prescription Drugs) within 3 months of when Medicare coverage begins to avoid any late enrollment penalties.

What if I’m still working past age 65?

If you are still working and have employer-based health insurance at a company with 20 employees or more, you can delay enrollment in Medicare until retirement. If, however, you work for a company with less than 20 employees, you will likely need to sign up for Medicare at age 65.

When your employment health plan coverage ends, you will need to add Part B within eight months of either a) the end of your employment or b) then end of your group health coverage. COBRA can help bridge the gap between employment coverage and Medicare. COBRA will end once Medicare begins.

If you are still working past age 65 and want to continue contributing to a Health Savings Account (HSA) with a high deductible plan, you will need to delay your Medicare Part A coverage.

What does Medicare cost?

Most beneficiaries will only pay the standard premium amount for Part B ($158.50 in 2022). They may be required to pay a premium based on their income represented in the chart below. Medicare uses the modified adjusted income from the beneficiary’s IRS tax return two years prior.

Typical cost for Part B is shown below with income ranges that increase Medicare premiums:

If you do not enroll in Medicare Part B when you are first eligible:

  • Your Part B monthly premium will increase 10% for each 12-month period that you are not enrolled.

  • You will pay a higher premium for the remainder of your life.

What if I need additional coverage?

Your IEP is also when you can buy Medicare Supplemental Insurance (also known as Medigap) from insurance companies. This is an additional policy that Medicare beneficiaries can purchase to cover the gaps in their Part A and Part B Medicare coverage. You are guaranteed the right to purchase this insurance without going through medical underwriting (i. e. you can’t be denied). This is critical if you have one or more chronic health conditions. Cost for Supplemental Insurance can typically range from $200 to $300 per month.

How do I sign up?

Sources: medicare.gov

Medicare can be a complicated concept, but the help of a professional can make all the difference. Please reach out to our team if you could use some guidance as you approach retirement.


Related Articles

2022 tax updates and a refresh on how tax brackets work
 

The IRS recently announced increases to both the standard deduction and tax brackets for taxpayers in 2022. Are you aware of how an increase to the standard deduction and an increase to tax brackets will impact you?

As you know, there are many headlines leading up to anticipated tax code changes, a litany of speculations throughout the process, and a cacophony of opinions once official tax code changes are announced. To be succinct, these two 2022 tax changes will have a small but favorable impact on most households. Everyone’s tax situation differs, but we wrote this blog to break down the complexities of the latest tax code changes.

What has changed?

1. The standard deduction will increase for the 2022 tax year. See below for a summary of the increases:

2. Federal income tax brackets will increase 3% for the 2022 tax year compared to 2021. Including a visual of the 2021 federal tax brackets is TMI for this post, but below are the new 2022 tax brackets:

what does this mean for me? it may not be much.

The practical answer is that these 2022 updates are not expected to have a significant impact on your taxes, cash flow, or budget. Both increases are good news for most households, but not life changing. To show how the changes are applied, we included a fictitious example and illustration below.

The academic or technical answer is that the increase in standard deduction means households will have less income subject to taxes, and the income that is subject to taxes will be subject to better tax brackets.

To provide an example of the impact of the 2022 increased standard deduction and 2022 increased tax brackets, read on.

Meet MARTIN & ANGELA

Below is a breakdown of their taxable income and taxes due in 2021 compared to 2022.

As you can see, they reported $100,000 of combined income which is reduced by their pre-tax 401(k) contributions and the standard deduction. Specifically, the standard deduction for married filed jointly is changing from $25,100 to $25,900 in 2022 so their taxable income is less than it was in 2021. Less taxable income puts Martin and Angela on track to pay less federal tax in 2022 than in 2021.

PORTIONS OF YOUR INCOME GET TAXED AT DIFFERENT RATES

Tax brackets calculate the tax rate you will pay on each portion of income. Tax brackets are part of our progressive tax system, which means the tax rate increases as someone’s income grows. As shown on the second image of this blog, there are 7 different federal tax brackets in 2022.

Looking at the image above, you can see that you can split your taxable income to take advantage of the lowest tax bracket. Isn’t it true that Martin and Angela would prefer to have a portion of their income taxed at the 10% rate before moving into the 12% tax bracket? In 2021, the maximum income allowed at the lowest tax bracket of 10% was $19,900. In 2022, the maximum income allowed will be $20,550.

DRUMROLL, PLEASE…

After this exercise is completed for all their taxable income, you can see that their total taxes owed in 2021 is $7,990 compared to $7,881 in 2022. As illustrated above, Martin and Angela will pay $109 less federal taxes in 2022 than they did in 2021. This will be welcomed news, but not a life-changing update when compared to the amount of buzz these two tax changes will generate in the media.

If you have questions about your unique tax situation, please schedule a time to connect with our team. As always, we would love to hear from you!

Disclaimer: this post is for educational purposes and not predictive of your 2022 tax situation. The fictitious example is not a full presentation of a tax filing.


Related Articles

The IRS Has Increased Contribution Limits for 2022
 

There is good news for retirement accounts! The IRS has increased the contribution limits for the upcoming year. As you can see below, an important change for 2022 is that 401(k) elective deferrals increased from $19,500 to $20,500. That’s not all! Please see below for the applicable updates for the coming year:

How do these changes impact your savings in the upcoming year? Are there any changes you should be making? Use this link to schedule a time to meet one-on-one with our team. We look forward to working with you in 2022!


Related Articles

Charts of Q3 2021
 

Welcome to fall! Before we race to the pumpkin patch, let’s look back on July, August and September. We selected 5 different visuals from the past quarter to share with you.

1: The S&P 500 Reaches an All-time High

On September 2, 2021, the S&P 500 closed at an all-time high (see chart). While this is a record-breaking statistic, the S&P 500 has also experienced more than 50 all-time highs in 2021. Prior to this year, there are only six other calendar years with at least 50 record closes (2017, 2014, and 1995 are the most recent years).

As a result of these market highs, we have noticed heightened concerns about a looming market crash. Because what goes up, must come down?? The two most common concerns we hear are:

  1. “I know the market is at an all-time high. I want to sell my investments today and reinvest these dollars when the market crashes in the coming months”. See chart 2 for our typical response.

  2. “I know the market is going to crash. I want to move all my money into something safe like cash or bonds. What do you think I should do?”

If you are someone that is worrying about your investments (maybe it’s something entirely different from the two concerns listed above), please reach out to our team so we can listen to your concerns and build an investment strategy for you going forward. To be frank, the timeline for spending 401(k) dollars impacts the advice we give. For example, we would give different advice to someone planning to spend their 401(k) savings soon than to someone in their mid-forties with no intentions of spending their 401(k) soon.

2: What About This Looming Market Crash?

If you have setup a 401(k) account, then you are investing your dollars every single pay period. This phenomenon is called dollar-cost averaging and it works really well for most retirement accounts. If you have a 401(k) account, we recommend leaning into dollar-cost averaging, setting up annual account rebalancing, and assessing your account strategy periodically. Of course, this strategy is not one-size-fits-all. Some investors prefer to intervene with their investments if they are predicting an upcoming market crash.

That being said, we recently found this article by Nick Maggiulli that compares gradually investing a consistent dollar amount (like per paycheck 401(k) contributions) to saving dollars up to buy a market dip. Please take the time to read the whole article, but if you want the cliff notes here you are:

  • The article points out that stockpiling cash in anticipation of a market crash is an unlikely strategy to win out in the long run.

  • Trying to buy the dip usually fails because large dips are rare. As a result, the strategy turns into stockpiling cash which is not a good idea for the long-term.

  • If you do want to try and buy the dip, think about getting your cash invested in the stock market as soon as possible.

For some help interpreting this chart, here is the text directly from Nick Maggulii’s blog post. “This chart shows that there is roughly a one in four chance of beating DCA when using a Buy the Dip strategy with a 10%-20% dip threshold. If you were to use a 50% dip threshold, the chance of outperforming DCA increases to nearly 40%. But this doesn’t come without a cost. Because while you are more likely to outperform DCA when using a bigger dip threshold, you also underperform by more (on average) as well.”

3: Monthly Child Tax Payments

July 2021 was the beginning of the monthly child tax credit payment for parents. Did you see our 20-minute webinar about the child tax credit, why it matters, and some financial planning considerations for parents?

Flash-forward a few months, and we have found a study of 1,514 American parents who received the monthly child tax credit payments. As you can see, most parents have saved their payments for emergencies which is a disciplined usage of the excess cash.

4: Vanguard Announces Lower Fees for Target Retirement Funds

In late August, Vanguard announced they are lowering the expense ratio (the cost) of their target-date funds by February 2022. We believe this is good news for all investors using Vanguard target retirement funds!

Vanguard will lower the expense ratio to 8 basis points meanwhile they are committed to maintaining the same glidepath methodology and asset allocation.

To articulate the cost savings, we assembled a table showing the potential impact for someone invested in a Vanguard target retirement fund with the updated expense ratio. For someone with $100,000 in a Vanguard target retirement fund, this lowered expense ratio means immediate annual savings. Just to be clear, the $90 vs $80 are annual fees which add up to be meaningful cost savings for you over a long period of time. Cheers!

5: Be Careful who you Get Advice From

How many self-proclaimed market savants are sharing their opinions with the world? So many! Be careful who you listen to. We couldn’t help but include some humor in this post. Feel free to relish in the ridiculousness of this chart.

That concludes our Charts of Q3 2021 post. We will be assembling the next Charts of the Quarter post before we know it. Take care! — Your Human Investing Team


signature-HI Team-401k-2021 copy.png
 

Related Articles

S&P Stock Market Performance and Capital Gains Tax Increases
 
wall st.jpg

Many of our blog articles are inspired by conversations we have throughout the week. This article on the S&P 500 stock market performance and capital gains tax increases is no exception. The question we are being asked is, "what do you think is going to happen with the market if capital gains go up?" Our recent response has been, "let us do some research and circle back to you." Here is what we found:

  1. Federal capital gains tax rates are currently near 70-year lows

  2. The proposed bill (House Ways & Means Committee, September 13, 2021) increases the top capital gains rate from 20% to 25% on income above $400,000.

  3. The previously proposed rate was 39.6% but kicked in at $1,000,000 of income.

  4. Table 1 below provides a side-by-side of the recent proposal with current capital gains rates and income brackets.

capital-gains-01-table.jpg

With this background on where rates have been and what is being proposed, we look to address the question, "so what happens to the market when capital gains rates go up?" Table 2 below tells an interesting story. Although there is market anxiety leading up to the proposed capital gain tax change, which results in a negative average return, the six months following the tax increase, the market is favorable. Wait, what? Excuse me for a minute while I reexamine Table 2. Ok, yes, the market is actually up after a proposed tax increase on capital gains.

capital-gains-02-table.jpg

As we have learned from our 25 years advising clients, anything is possible, and history does not always repeat itself. Another lesson learned from experience is that the market does not care about our charts, nor does it give a rip about our attempt to explain what might be. It is nice to know that cap gains tax hikes do not always mean turbulent markets are ahead. In fact, the market has performed above the historical average when a cap gain tax hike is put in place—at least, that is the case for the six months following the increase.


Related Articles

Dr. Peter Fisher